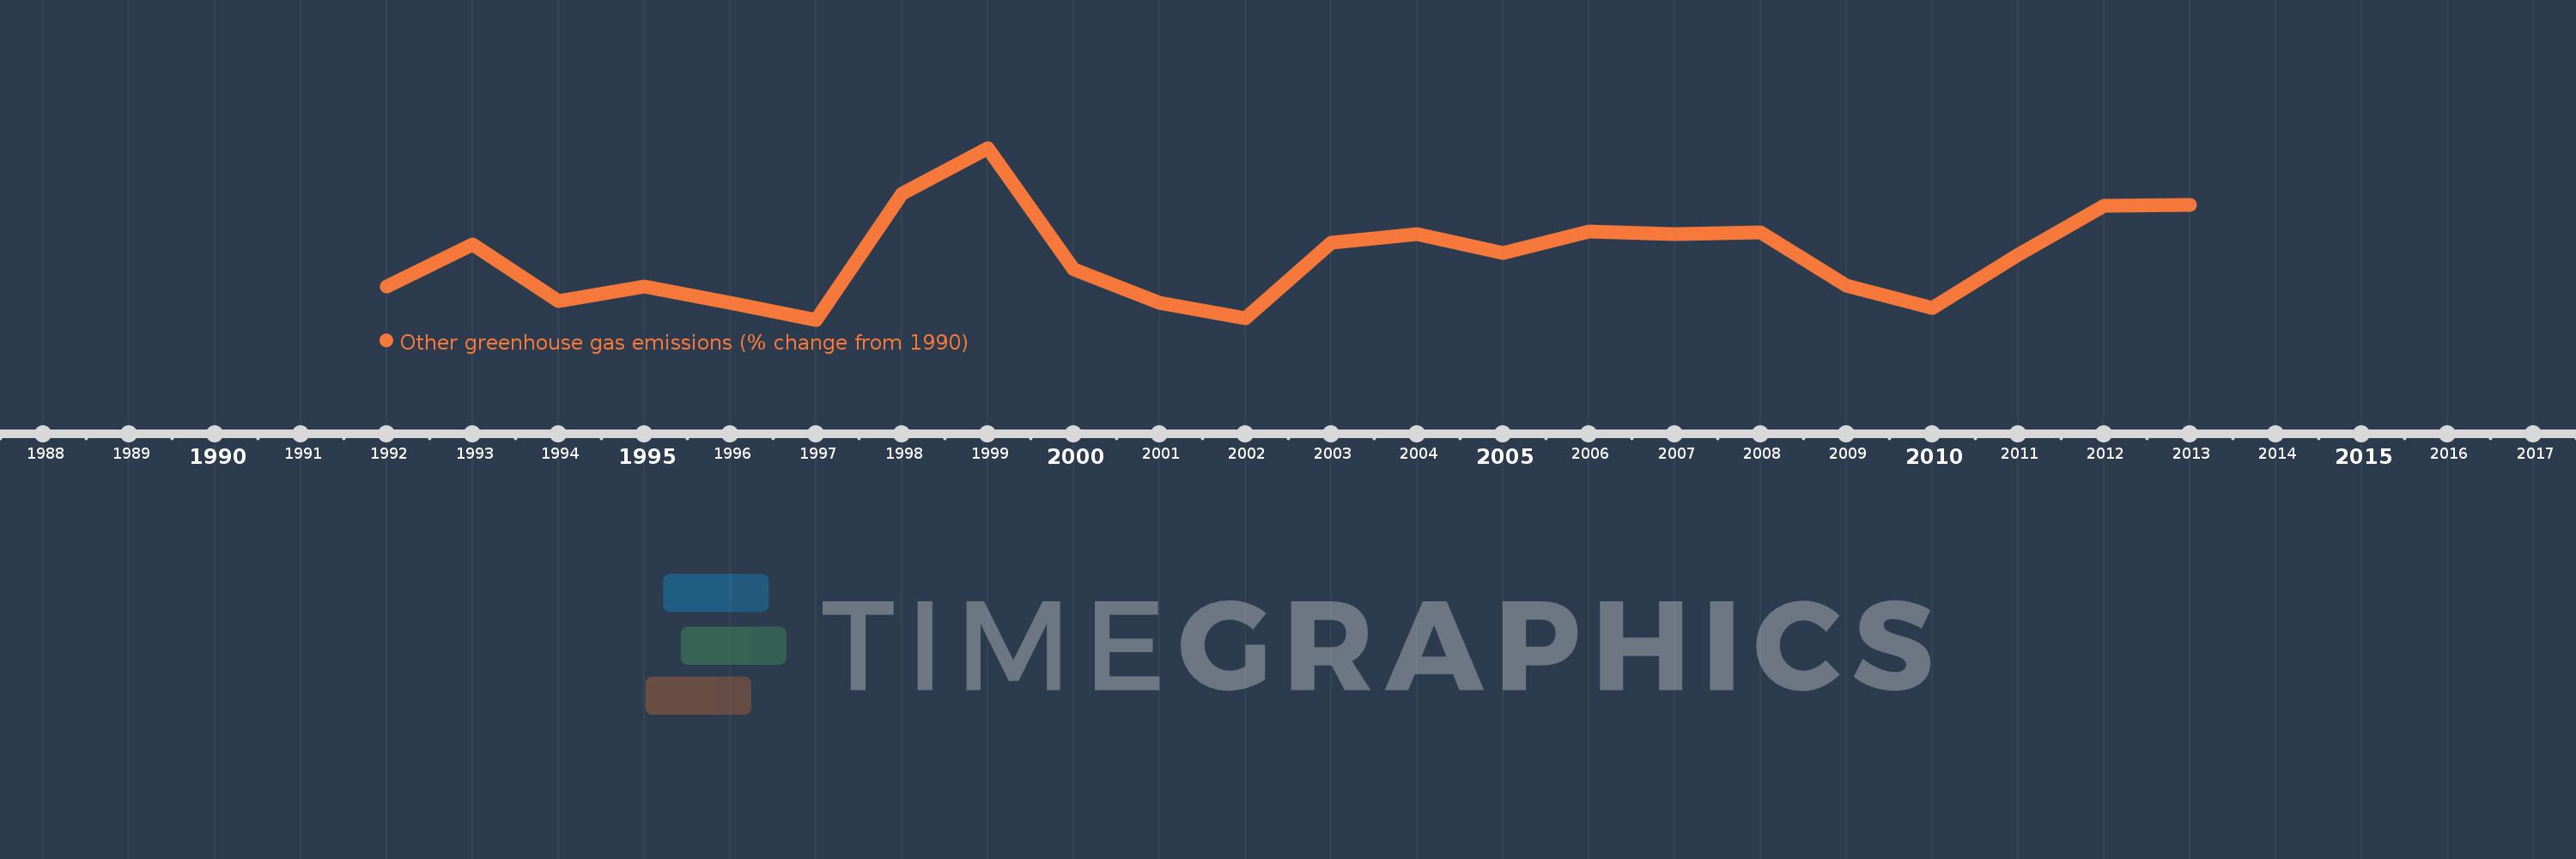
This timeline shows a graph from 1992 to 2013 of World. No data until 1991. Number of actual observations by date: 22.
Source name:
World Development Indicators
Source organization:
World Bank staff estimates from original source: European Commission, Joint Research Centre (JRC)/Netherlands Environmental Assessment Agency (PBL). Emission Database for Global Atmospheric Research (EDGAR): http://edgar.jrc.ec.europa.eu/.
Categories, topics:
Climate Change, Environment
Last updated:
apr 23, 2017
Indicators value changes by year
Meaning:
17.798
Minimum:
-7.836
jan 1, 1997
Maximum:
62.665
jan 1, 1999
At the date of observation
Value
Absolute change
Change from the previous value
jan 1, 1992
5.74
+5.74
0.0%
jan 1, 1993
23.14
+17.4
303.12%
jan 1, 1994
-0.173
-23.313
-100.75%
jan 1, 1995
5.718
+5.891
-3.4K%
jan 1, 1996
-0.965
-6.683
-116.88%
jan 1, 1997
-7.836
-6.87
711.7%
jan 1, 1998
43.782
+51.618
-658.75%
jan 1, 1999
62.665
+18.883
43.13%
jan 1, 2000
12.723
-49.942
-79.7%
jan 1, 2001
-0.801
-13.524
-106.29%
jan 1, 2002
-7.27
-6.47
808.18%
jan 1, 2003
23.91
+31.18
-428.87%
jan 1, 2004
27.301
+3.391
14.18%
jan 1, 2005
19.628
-7.673
-28.11%
jan 1, 2006
28.356
+8.728
44.47%
jan 1, 2007
27.477
-0.879
-3.1%
jan 1, 2008
28.034
+0.557
2.03%
jan 1, 2009
6.122
-21.912
-78.16%
jan 1, 2010
-2.842
-8.964
-146.43%
jan 1, 2011
18.832
+21.674
-762.51%
jan 1, 2012
38.777
+19.946
105.91%
jan 1, 2013
39.235
+0.458
1.18%
Ranking of countries by current statistics by years