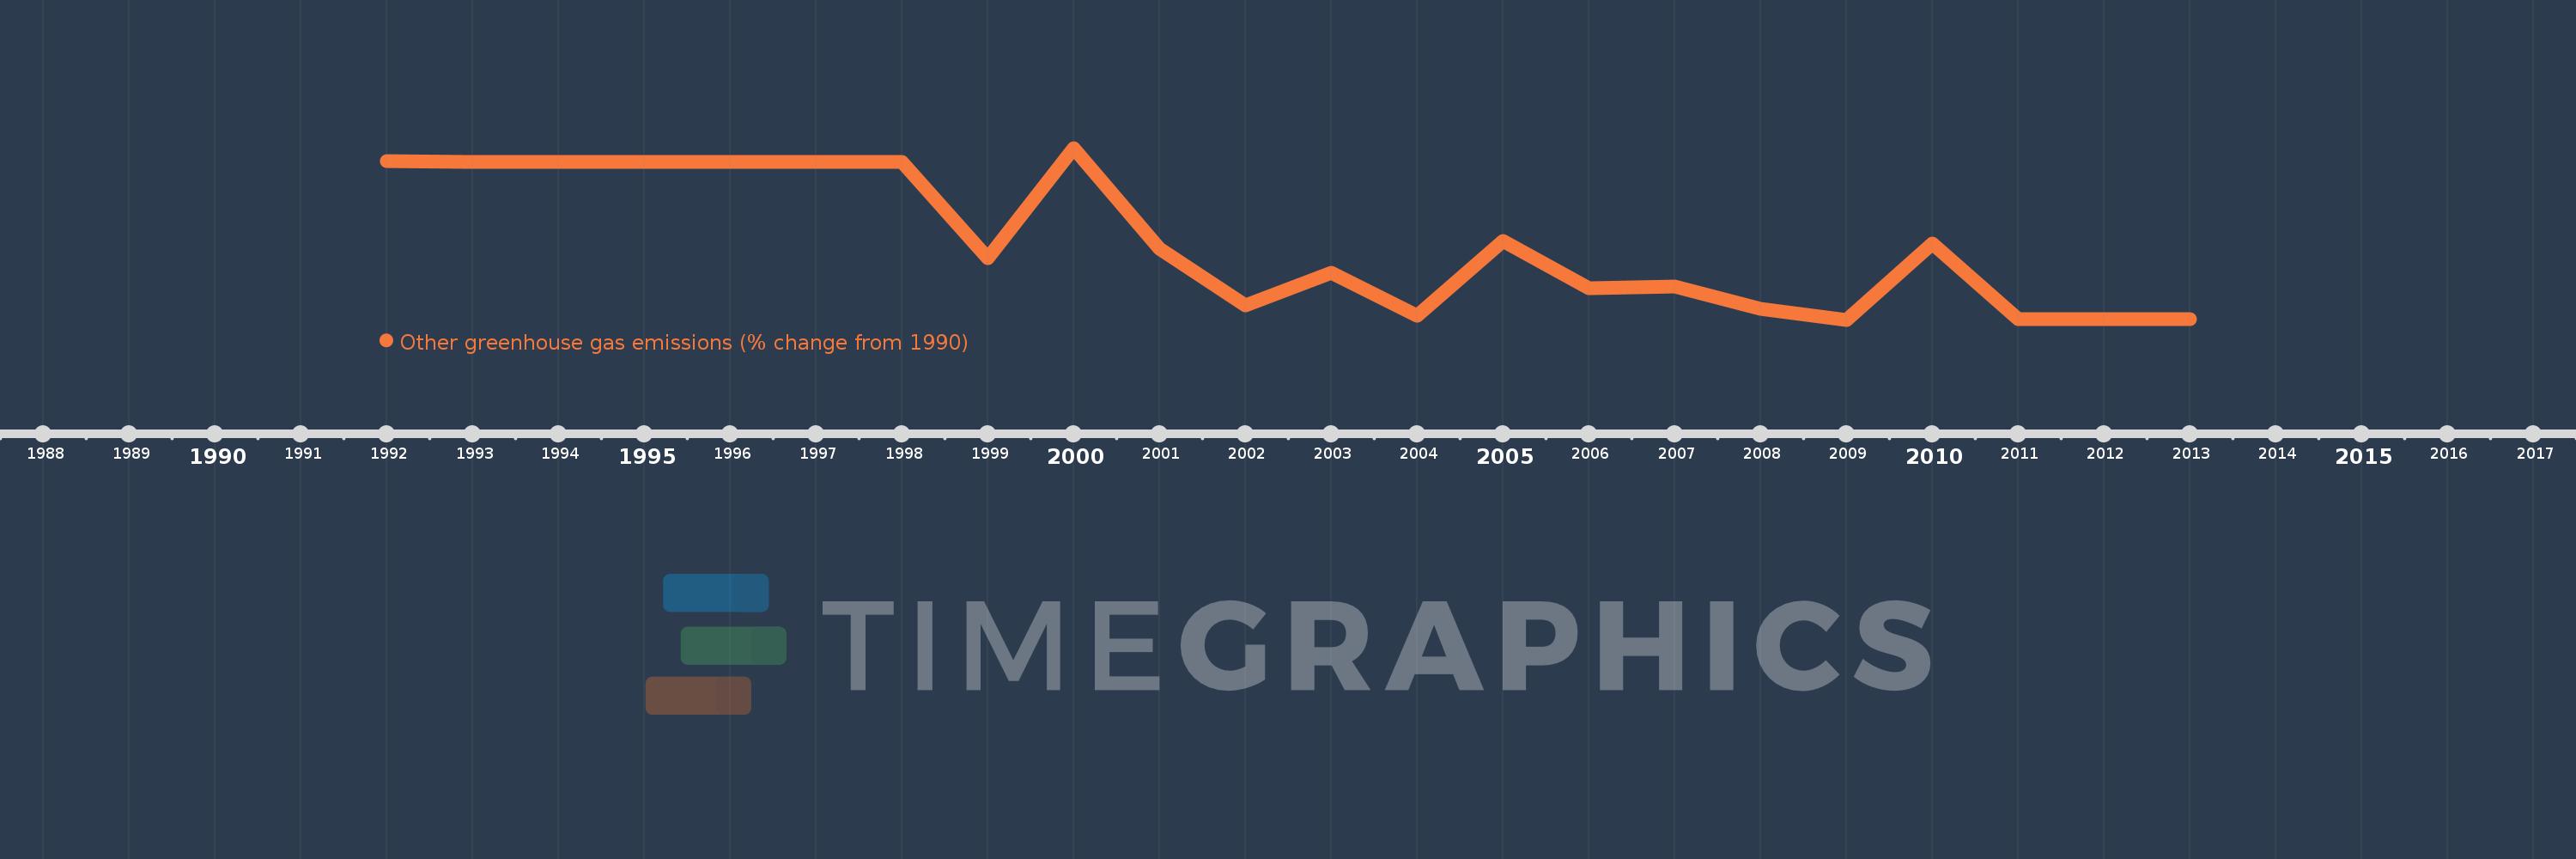
This timeline shows a graph from 1992 to 2013 of Sri Lanka. No data until 1991. Number of actual observations by date: 22.
Source name:
World Development Indicators
Source organization:
World Bank staff estimates from original source: European Commission, Joint Research Centre (JRC)/Netherlands Environmental Assessment Agency (PBL). Emission Database for Global Atmospheric Research (EDGAR): http://edgar.jrc.ec.europa.eu/.
Categories, topics:
Climate Change, Environment
Last updated:
apr 23, 2017
Indicators value changes by year
Meaning:
-45.887
Minimum:
-90.129
jan 1, 2009
Maximum:
7.65
jan 1, 2000
At the date of observation
Value
Absolute change
Change from the previous value
jan 1, 1992
-0.051
-0.051
0.0%
jan 1, 1993
-0.102
-0.051
100.0%
jan 1, 1994
-0.153
-0.051
50.0%
jan 1, 1995
-0.204
-0.051
33.33%
jan 1, 1996
-0.254
-0.051
25.02%
jan 1, 1997
-0.305
-0.051
20.0%
jan 1, 1998
-0.356
-0.051
16.66%
jan 1, 1999
-55.104
-54.747
15.37K%
jan 1, 2000
7.65
+62.753
-113.88%
jan 1, 2001
-49.466
-57.116
-746.64%
jan 1, 2002
-82.155
-32.688
66.08%
jan 1, 2003
-63.234
+18.921
-23.03%
jan 1, 2004
-87.703
-24.469
38.7%
jan 1, 2005
-45.209
+42.494
-48.45%
jan 1, 2006
-72.27
-27.062
59.86%
jan 1, 2007
-70.985
+1.285
-1.78%
jan 1, 2008
-84.028
-13.043
18.37%
jan 1, 2009
-90.129
-6.101
7.26%
jan 1, 2010
-46.696
+43.433
-48.19%
jan 1, 2011
-89.587
-42.891
91.85%
jan 1, 2012
-89.587
0.0
0.0%
jan 1, 2013
-89.587
0.0
0.0%
Ranking of countries by current statistics by years