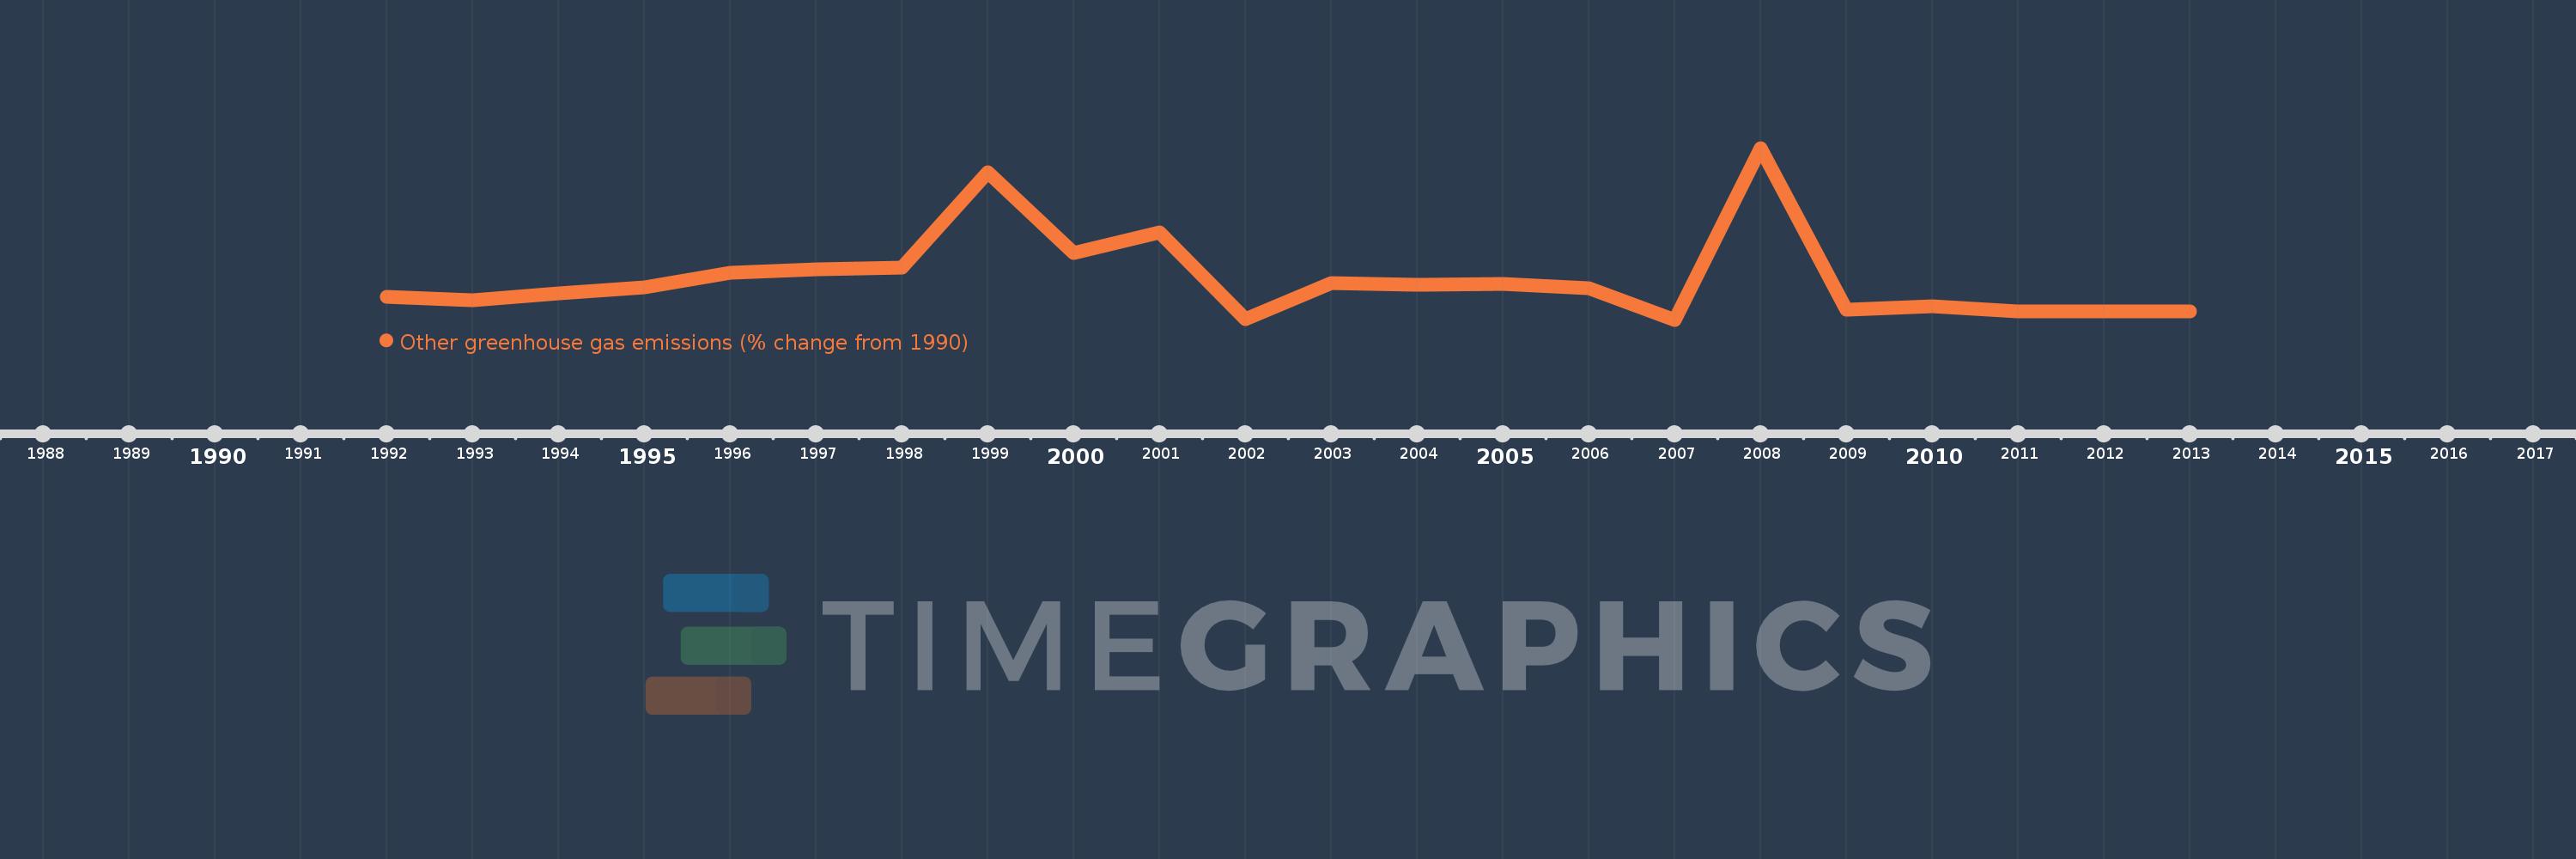
This timeline shows a graph from 1992 to 2013 of Greece. No data until 1991. Number of actual observations by date: 22.
Source name:
World Development Indicators
Source organization:
World Bank staff estimates from original source: European Commission, Joint Research Centre (JRC)/Netherlands Environmental Assessment Agency (PBL). Emission Database for Global Atmospheric Research (EDGAR): http://edgar.jrc.ec.europa.eu/.
Categories, topics:
Climate Change, Environment
Last updated:
apr 23, 2017
Indicators value changes by year
Meaning:
7.242
Minimum:
-53.17
jan 1, 2007
Maximum:
197.874
jan 1, 2008
At the date of observation
Value
Absolute change
Change from the previous value
jan 1, 1992
-19.355
-19.355
0.0%
jan 1, 1993
-24.592
-5.236
27.05%
jan 1, 1994
-14.814
+9.777
-39.76%
jan 1, 1995
-5.69
+9.124
-61.59%
jan 1, 1996
15.134
+20.825
-365.98%
jan 1, 1997
19.972
+4.837
31.96%
jan 1, 1998
22.534
+2.562
12.83%
jan 1, 1999
162.013
+139.48
618.98%
jan 1, 2000
43.763
-118.25
-72.99%
jan 1, 2001
74.402
+30.639
70.01%
jan 1, 2002
-52.317
-126.719
-170.32%
jan 1, 2003
0.295
+52.612
-100.56%
jan 1, 2004
-2.496
-2.792
-944.99%
jan 1, 2005
-1.105
+1.392
-55.75%
jan 1, 2006
-7.339
-6.234
564.43%
jan 1, 2007
-53.17
-45.831
624.5%
jan 1, 2008
197.874
+251.044
-472.16%
jan 1, 2009
-38.645
-236.519
-119.53%
jan 1, 2010
-33.743
+4.902
-12.69%
jan 1, 2011
-41.135
-7.392
21.91%
jan 1, 2012
-41.135
0.0
0.0%
jan 1, 2013
-41.135
+0.0
0.0%
Ranking of countries by current statistics by years