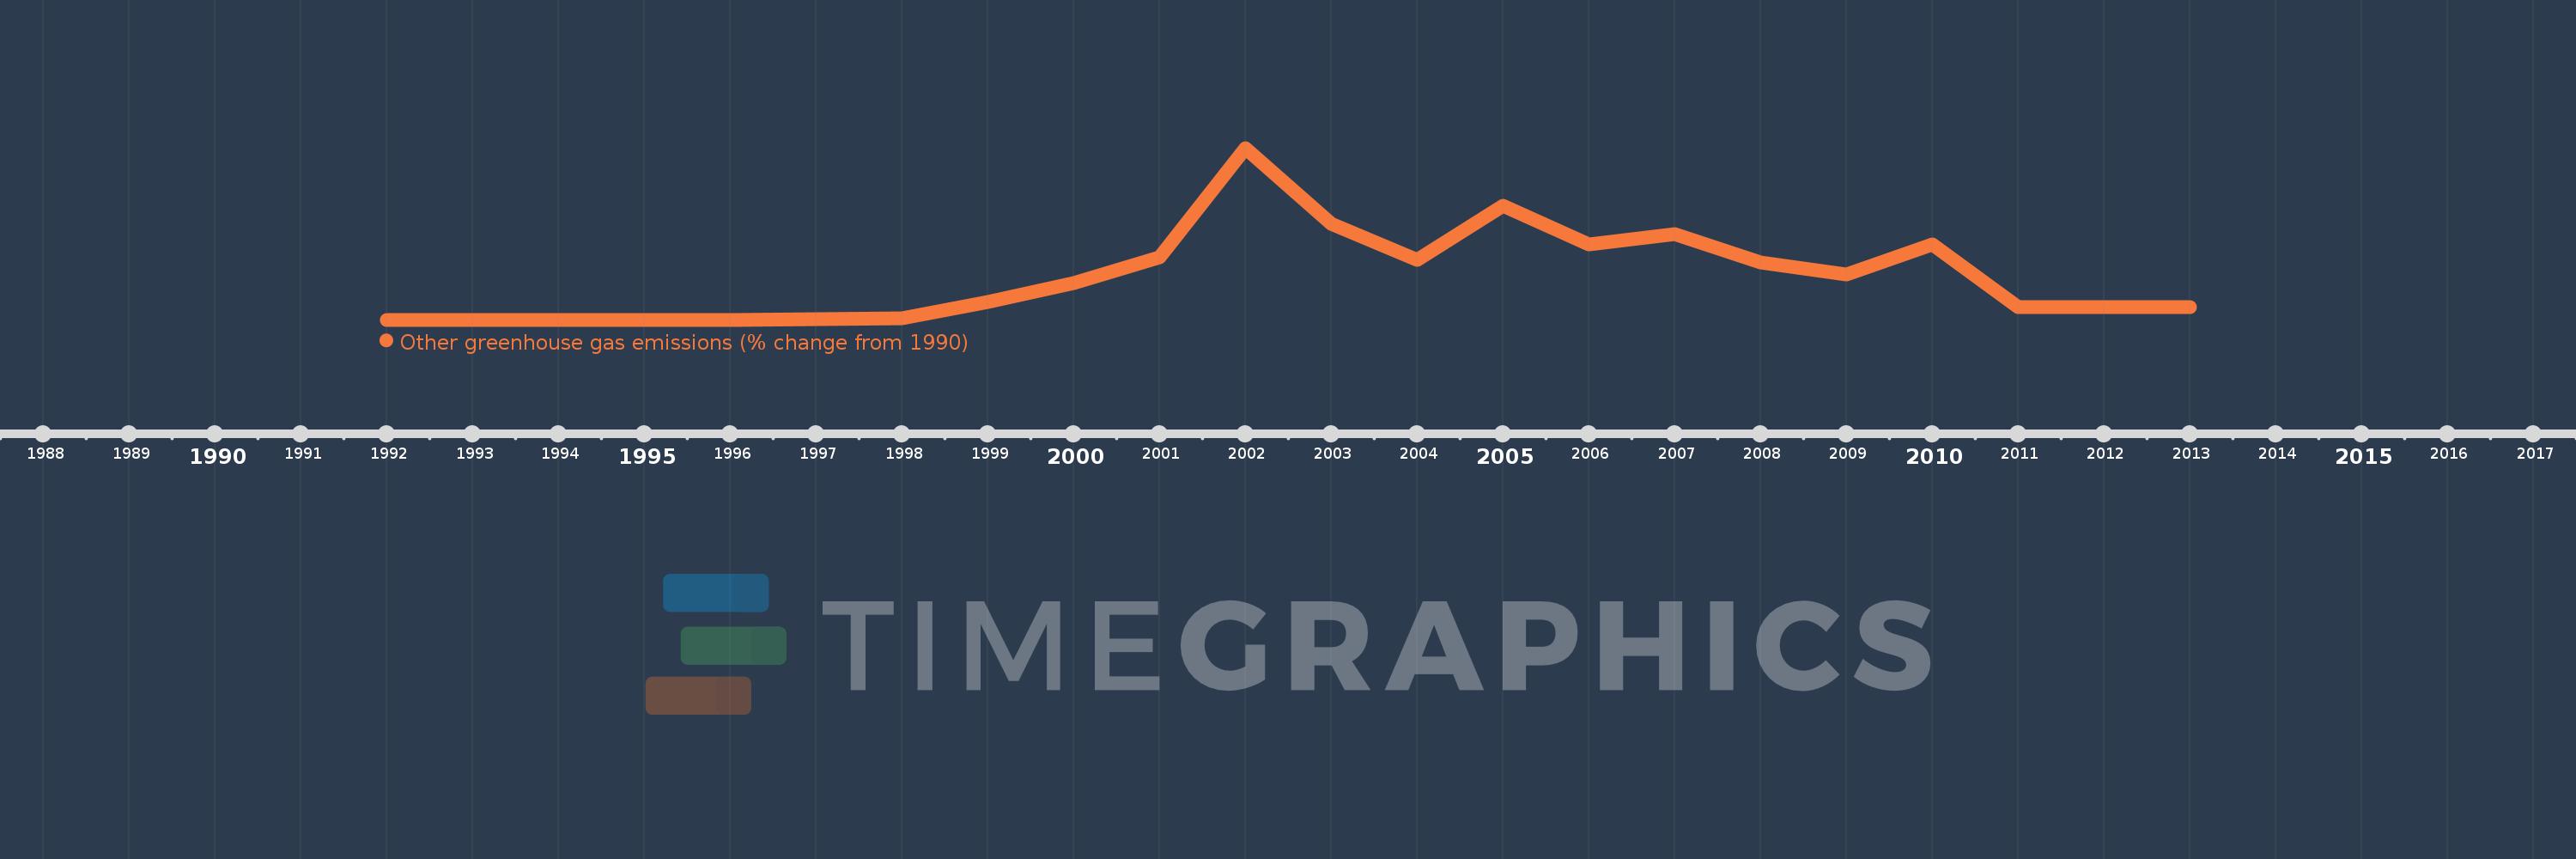
This timeline shows a graph from 1992 to 2013 of El Salvador. No data until 1991. Number of actual observations by date: 22.
Source name:
World Development Indicators
Source organization:
World Bank staff estimates from original source: European Commission, Joint Research Centre (JRC)/Netherlands Environmental Assessment Agency (PBL). Emission Database for Global Atmospheric Research (EDGAR): http://edgar.jrc.ec.europa.eu/.
Categories, topics:
Climate Change, Environment
Last updated:
apr 23, 2017
Indicators value changes by year
Meaning:
260.813
Minimum:
0.001
jan 1, 1992
Maximum:
1.054K
jan 1, 2002
At the date of observation
Value
Absolute change
Change from the previous value
jan 1, 1992
0.001
+0.001
0.0%
jan 1, 1993
0.003
+0.002
309.47%
jan 1, 1994
0.014
+0.011
370.74%
jan 1, 1995
0.036
+0.022
160.73%
jan 1, 1996
0.084
+0.047
129.8%
jan 1, 1997
3.2
+3.116
3.72K%
jan 1, 1998
8.037
+4.837
151.18%
jan 1, 1999
108.718
+100.681
1.25K%
jan 1, 2000
225.097
+116.379
107.05%
jan 1, 2001
384.249
+159.152
70.7%
jan 1, 2002
1.054K
+669.443
174.22%
jan 1, 2003
587.2
-466.492
-44.27%
jan 1, 2004
369.532
-217.668
-37.07%
jan 1, 2005
696.596
+327.065
88.51%
jan 1, 2006
463.004
-233.592
-33.53%
jan 1, 2007
526.202
+63.197
13.65%
jan 1, 2008
349.229
-176.972
-33.63%
jan 1, 2009
276.627
-72.602
-20.79%
jan 1, 2010
460.398
+183.771
66.43%
jan 1, 2011
75.324
-385.074
-83.64%
jan 1, 2012
75.324
0.0
0.0%
jan 1, 2013
75.324
0.0
0.0%
Ranking of countries by current statistics by years