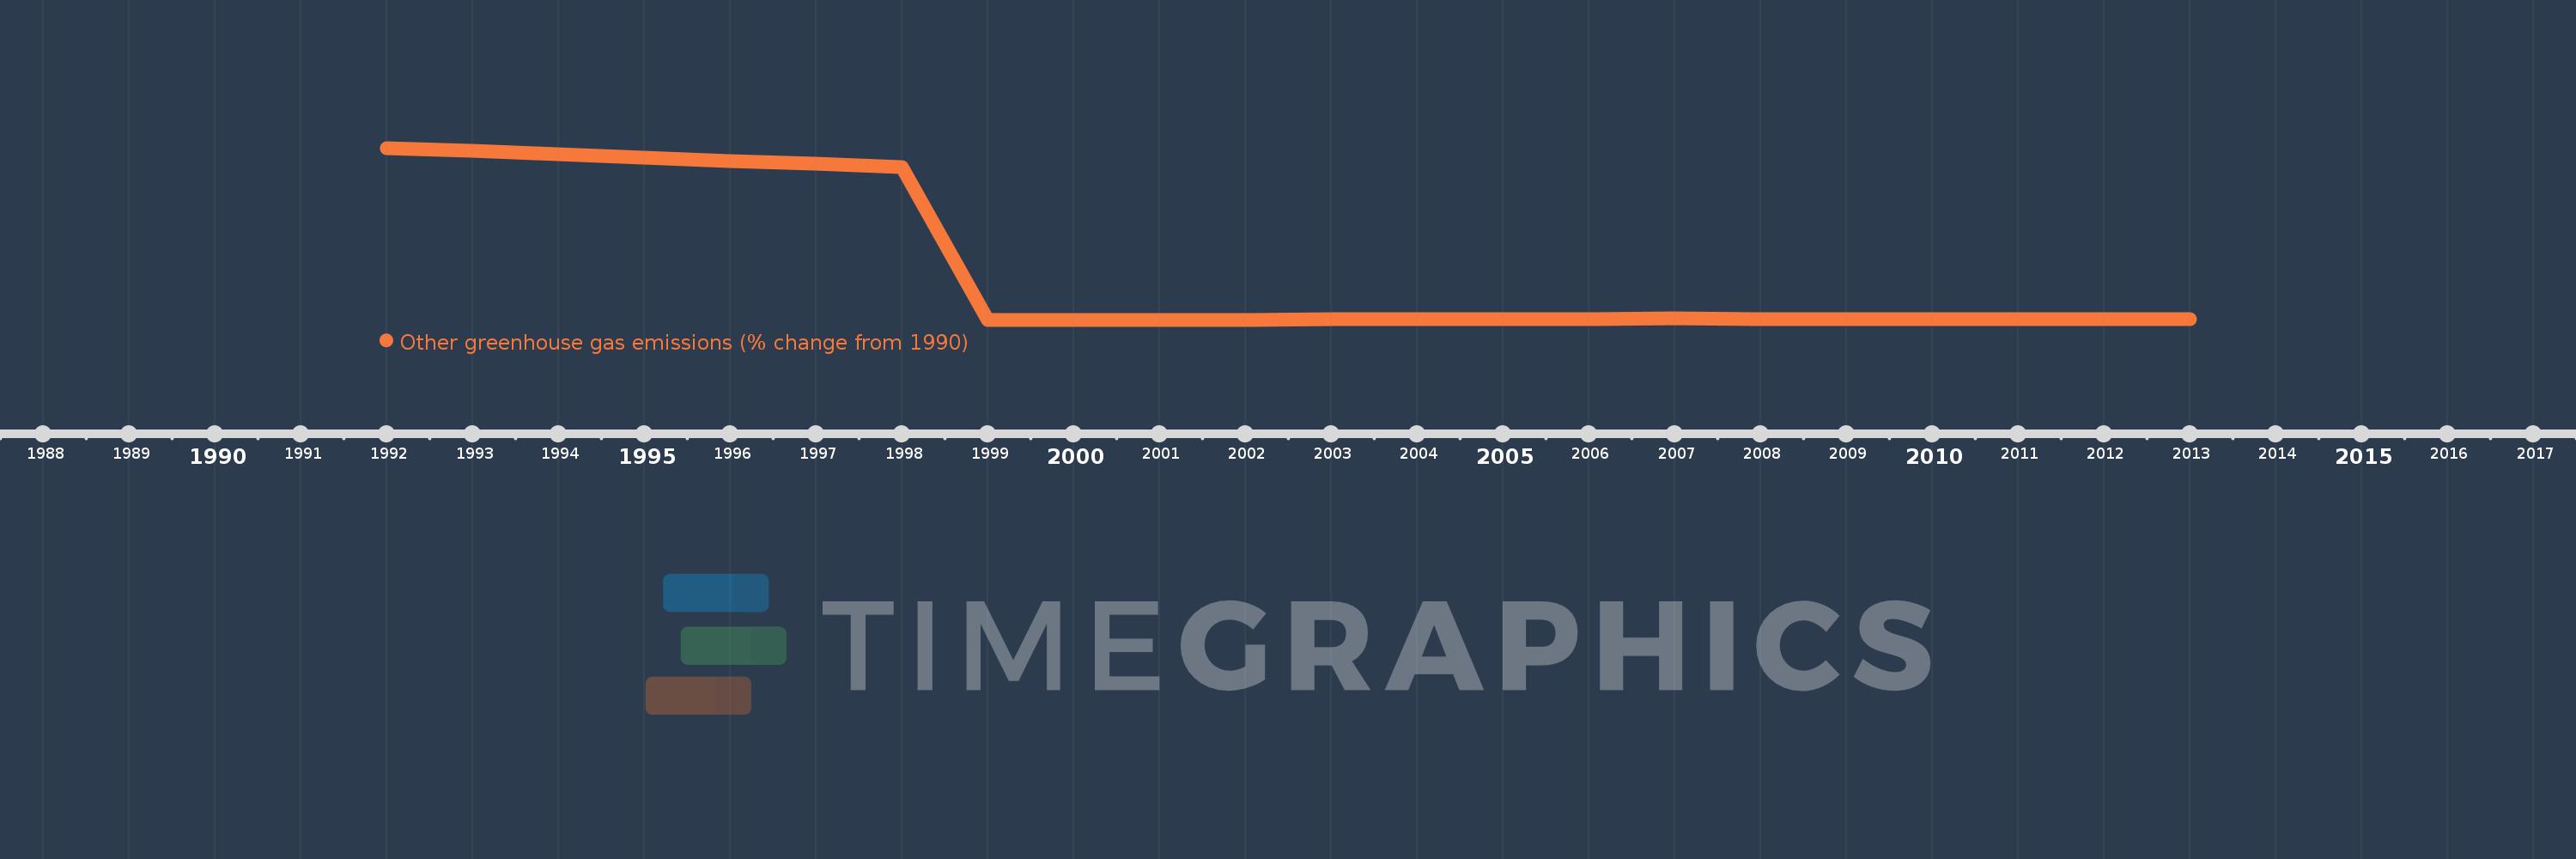
This timeline shows a graph from 1992 to 2013 of Estonia. No data until 1991. Number of actual observations by date: 22.
Source name:
World Development Indicators
Source organization:
World Bank staff estimates from original source: European Commission, Joint Research Centre (JRC)/Netherlands Environmental Assessment Agency (PBL). Emission Database for Global Atmospheric Research (EDGAR): http://edgar.jrc.ec.europa.eu/.
Categories, topics:
Climate Change, Environment
Last updated:
apr 23, 2017
Indicators value changes by year
Meaning:
-70.315
Minimum:
-99.934
jan 1, 1999
Maximum:
-1.878
jan 1, 1992
At the date of observation
Value
Absolute change
Change from the previous value
jan 1, 1992
-1.878
-1.878
0.0%
jan 1, 1993
-3.739
-1.862
99.14%
jan 1, 1994
-5.584
-1.844
49.32%
jan 1, 1995
-7.412
-1.828
32.74%
jan 1, 1996
-9.217
-1.805
24.36%
jan 1, 1997
-11.006
-1.789
19.41%
jan 1, 1998
-12.777
-1.771
16.09%
jan 1, 1999
-99.934
-87.157
682.16%
jan 1, 2000
-99.92
+0.013
-0.01%
jan 1, 2001
-99.905
+0.016
-0.02%
jan 1, 2002
-99.884
+0.021
-0.02%
jan 1, 2003
-99.626
+0.257
-0.26%
jan 1, 2004
-99.784
-0.158
0.16%
jan 1, 2005
-99.735
+0.049
-0.05%
jan 1, 2006
-99.716
+0.019
-0.02%
jan 1, 2007
-99.34
+0.375
-0.38%
jan 1, 2008
-99.653
-0.312
0.31%
jan 1, 2009
-99.615
+0.038
-0.04%
jan 1, 2010
-99.572
+0.043
-0.04%
jan 1, 2011
-99.541
+0.03
-0.03%
jan 1, 2012
-99.541
0.0
0.0%
jan 1, 2013
-99.541
+0.0
0.0%
Ranking of countries by current statistics by years