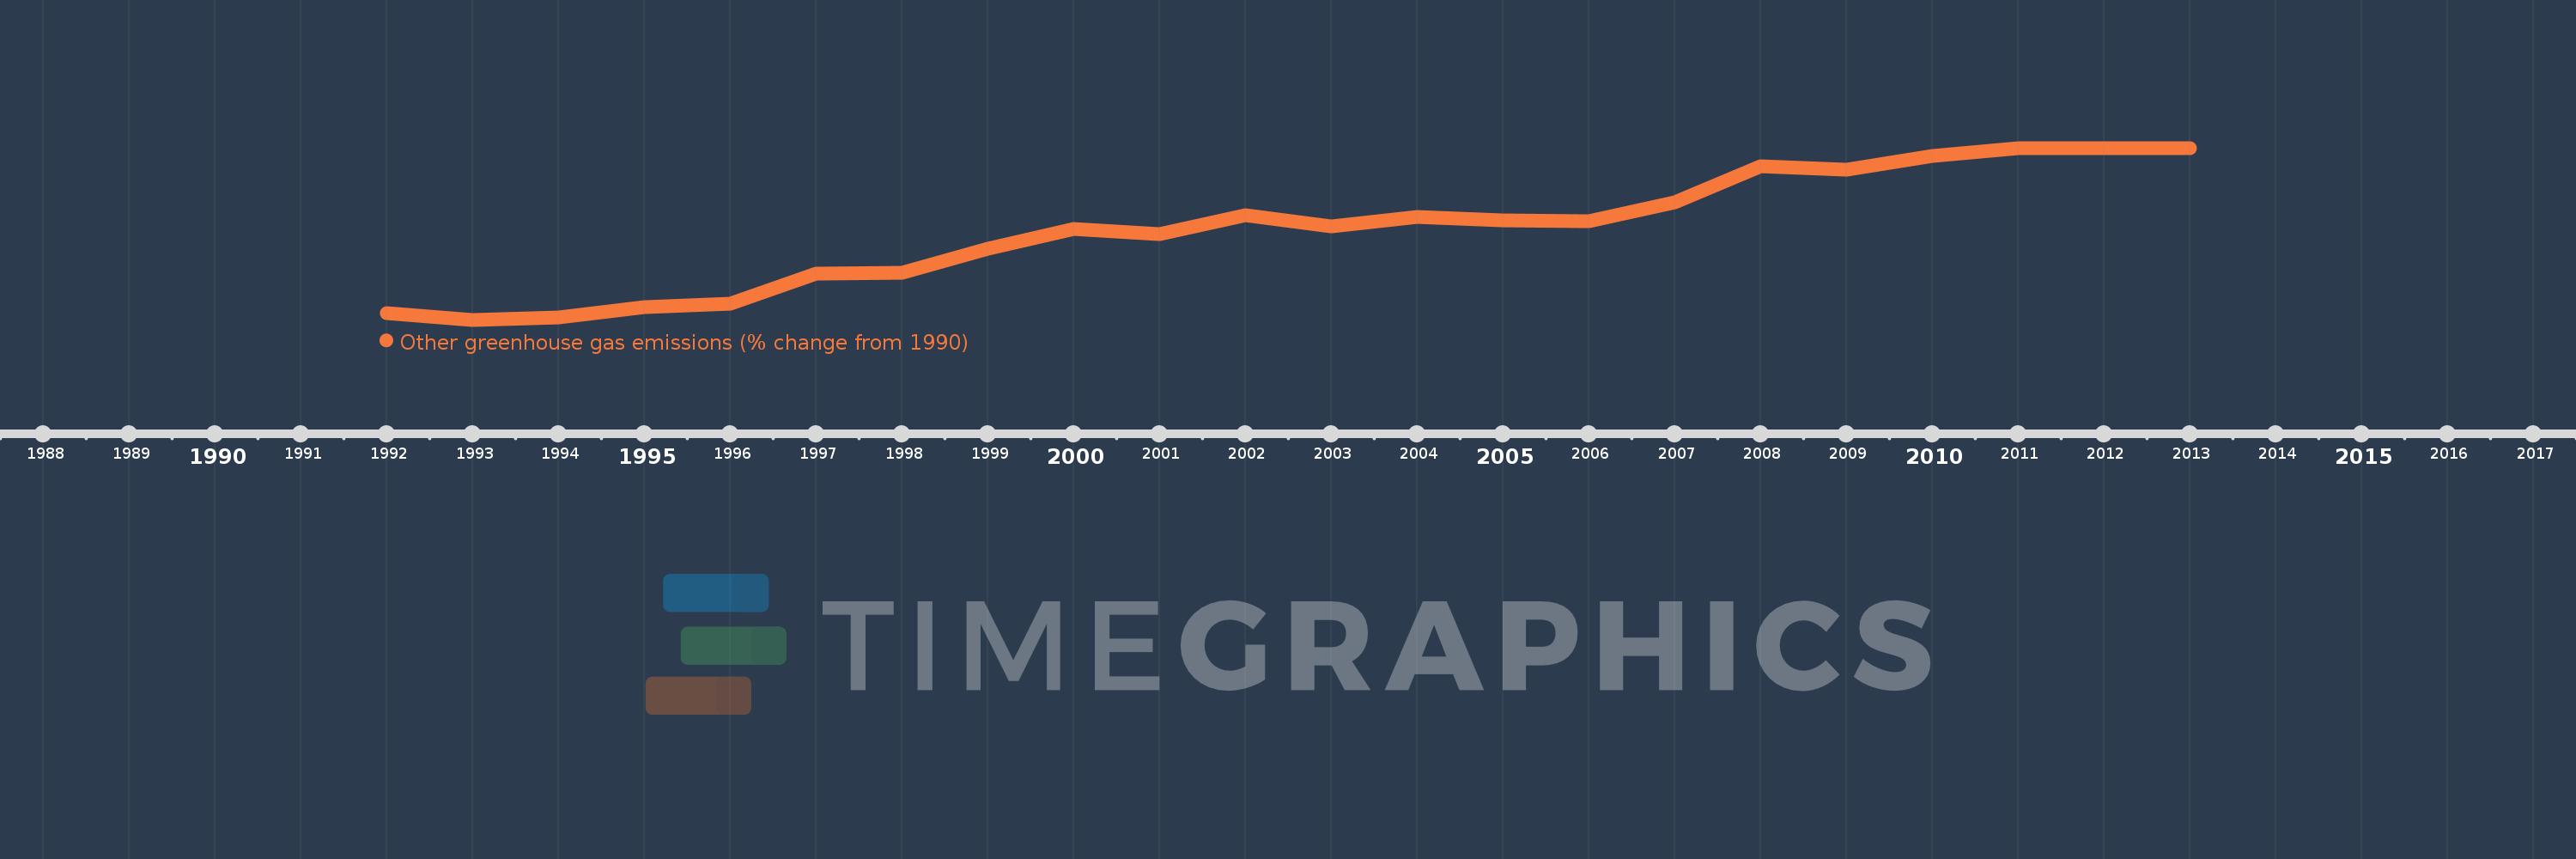
This timeline shows a graph from 1992 to 2013 of Italy. No data until 1991. Number of actual observations by date: 22.
Source name:
World Development Indicators
Source organization:
World Bank staff estimates from original source: European Commission, Joint Research Centre (JRC)/Netherlands Environmental Assessment Agency (PBL). Emission Database for Global Atmospheric Research (EDGAR): http://edgar.jrc.ec.europa.eu/.
Categories, topics:
Climate Change, Environment
Last updated:
apr 23, 2017
Indicators value changes by year
Meaning:
115.599
Minimum:
-12.668
jan 1, 1993
Maximum:
232.596
jan 1, 2011
At the date of observation
Value
Absolute change
Change from the previous value
jan 1, 1992
-3.757
-3.757
0.0%
jan 1, 1993
-12.668
-8.911
237.15%
jan 1, 1994
-9.128
+3.54
-27.95%
jan 1, 1995
5.791
+14.919
-163.45%
jan 1, 1996
9.927
+4.136
71.41%
jan 1, 1997
53.584
+43.657
439.76%
jan 1, 1998
54.086
+0.502
0.94%
jan 1, 1999
88.189
+34.103
63.05%
jan 1, 2000
116.581
+28.392
32.19%
jan 1, 2001
109.791
-6.79
-5.82%
jan 1, 2002
136.778
+26.987
24.58%
jan 1, 2003
120.818
-15.96
-11.67%
jan 1, 2004
133.682
+12.864
10.65%
jan 1, 2005
128.985
-4.697
-3.51%
jan 1, 2006
128.301
-0.684
-0.53%
jan 1, 2007
155.196
+26.894
20.96%
jan 1, 2008
206.983
+51.788
33.37%
jan 1, 2009
201.434
-5.549
-2.68%
jan 1, 2010
220.814
+19.38
9.62%
jan 1, 2011
232.596
+11.782
5.34%
jan 1, 2012
232.596
0.0
0.0%
jan 1, 2013
232.596
0.0
0.0%
Ranking of countries by current statistics by years