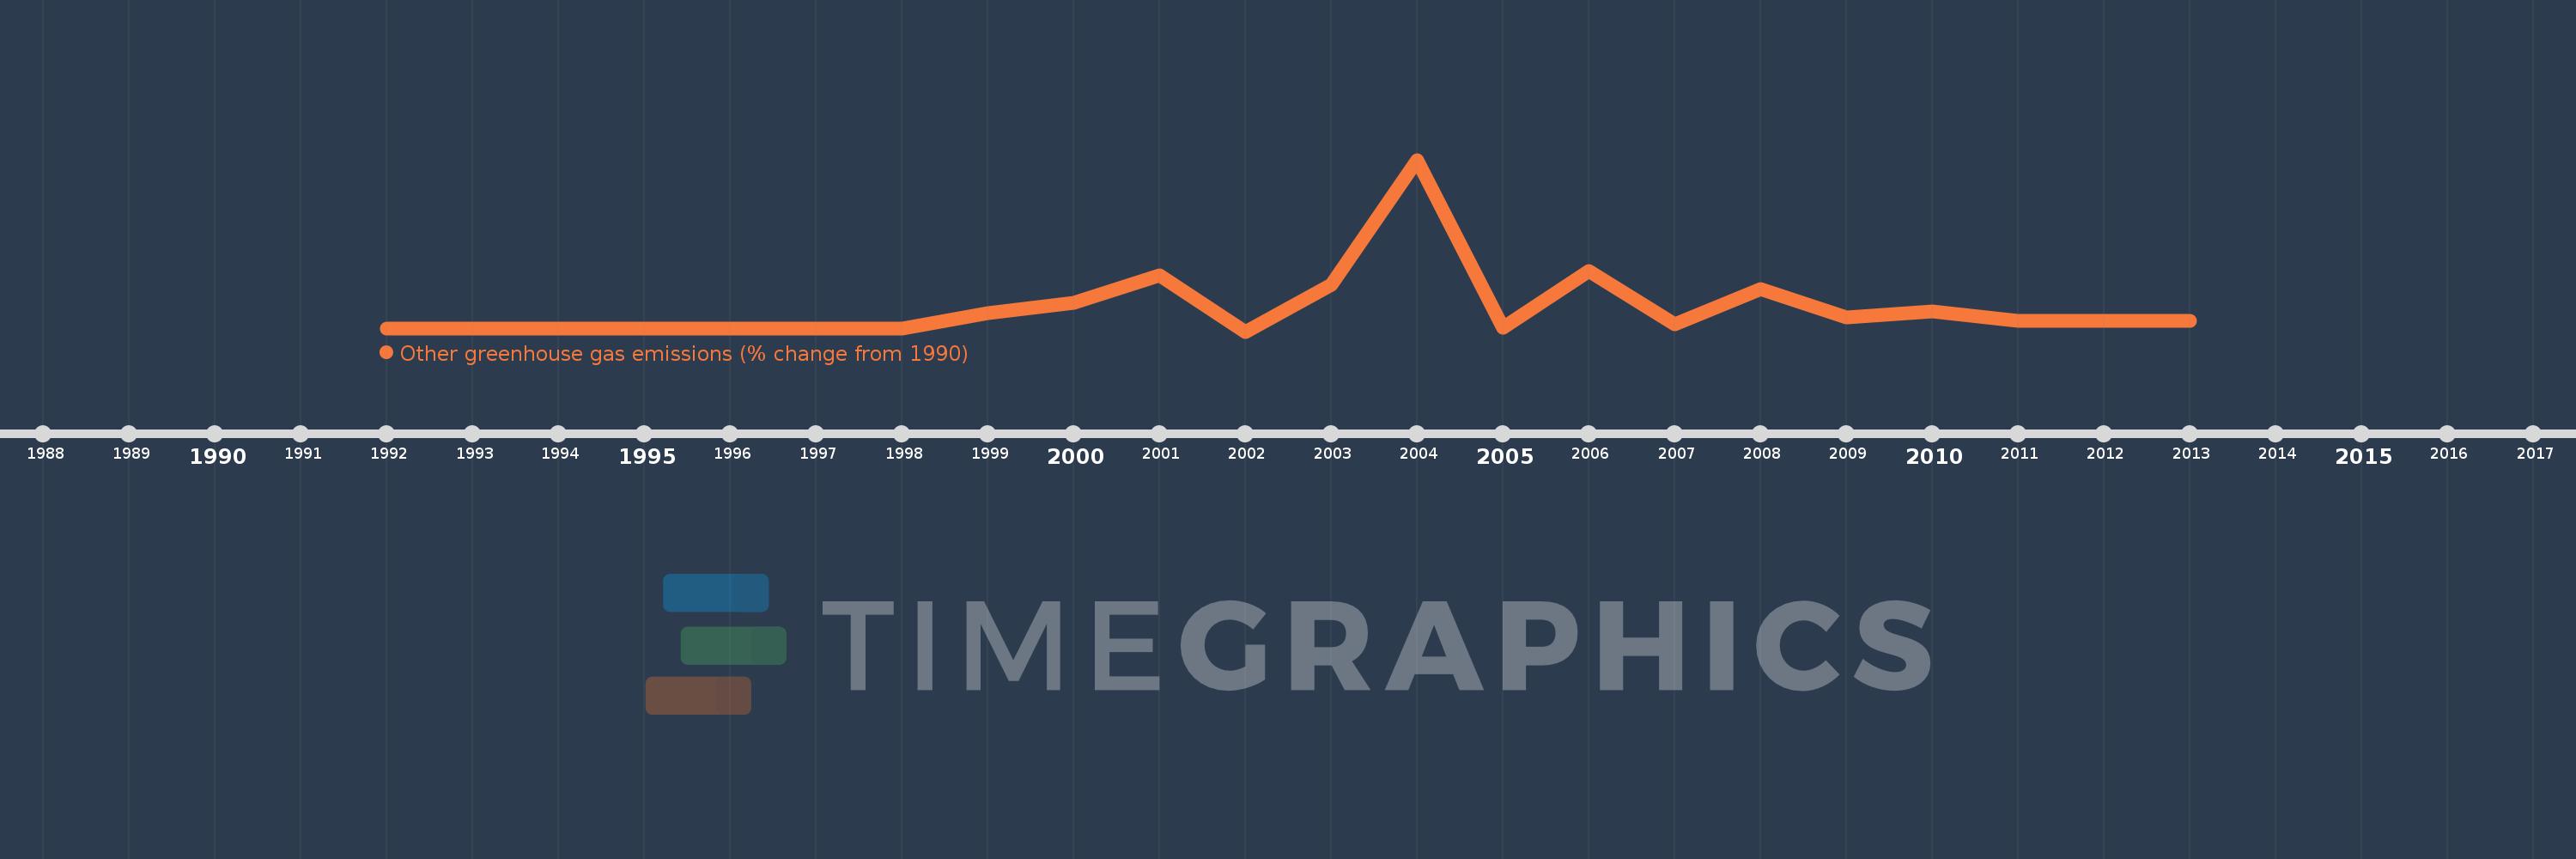
This timeline shows a graph from 1992 to 2013 of Belize. No data until 1991. Number of actual observations by date: 22.
Source name:
World Development Indicators
Source organization:
World Bank staff estimates from original source: European Commission, Joint Research Centre (JRC)/Netherlands Environmental Assessment Agency (PBL). Emission Database for Global Atmospheric Research (EDGAR): http://edgar.jrc.ec.europa.eu/.
Categories, topics:
Climate Change, Environment
Last updated:
apr 23, 2017
Indicators value changes by year
Meaning:
791.818
Minimum:
-100.0
jan 1, 2002
Maximum:
6.35K
jan 1, 2004
At the date of observation
Value
Absolute change
Change from the previous value
jan 1, 1992
0.0
0.0
0.0%
jan 1, 1993
0.0
0.0
0.0%
jan 1, 1994
0.0
0.0
104.55%
jan 1, 1995
0.0
+0.0
-51.11%
jan 1, 1996
0.0
0.0
0.0%
jan 1, 1997
0.0
0.0
0.0%
jan 1, 1998
0.0
0.0
104.55%
jan 1, 1999
605.0
+605.0
-121096.79 trl%
jan 1, 2000
992.5
+387.5
64.05%
jan 1, 2001
2.002K
+1.01K
101.76%
jan 1, 2002
-100.0
-2.103K
-104.99%
jan 1, 2003
1.65K
+1.75K
-1.75K%
jan 1, 2004
6.35K
+4.7K
284.85%
jan 1, 2005
57.5
-6.293K
-99.09%
jan 1, 2006
2.175K
+2.118K
3.68K%
jan 1, 2007
180.0
-1.995K
-91.72%
jan 1, 2008
1.51K
+1.33K
738.89%
jan 1, 2009
420.0
-1.09K
-72.19%
jan 1, 2010
647.5
+227.5
54.17%
jan 1, 2011
310.0
-337.5
-52.12%
jan 1, 2012
310.0
0.0
0.0%
jan 1, 2013
310.0
0.0
0.0%
Ranking of countries by current statistics by years