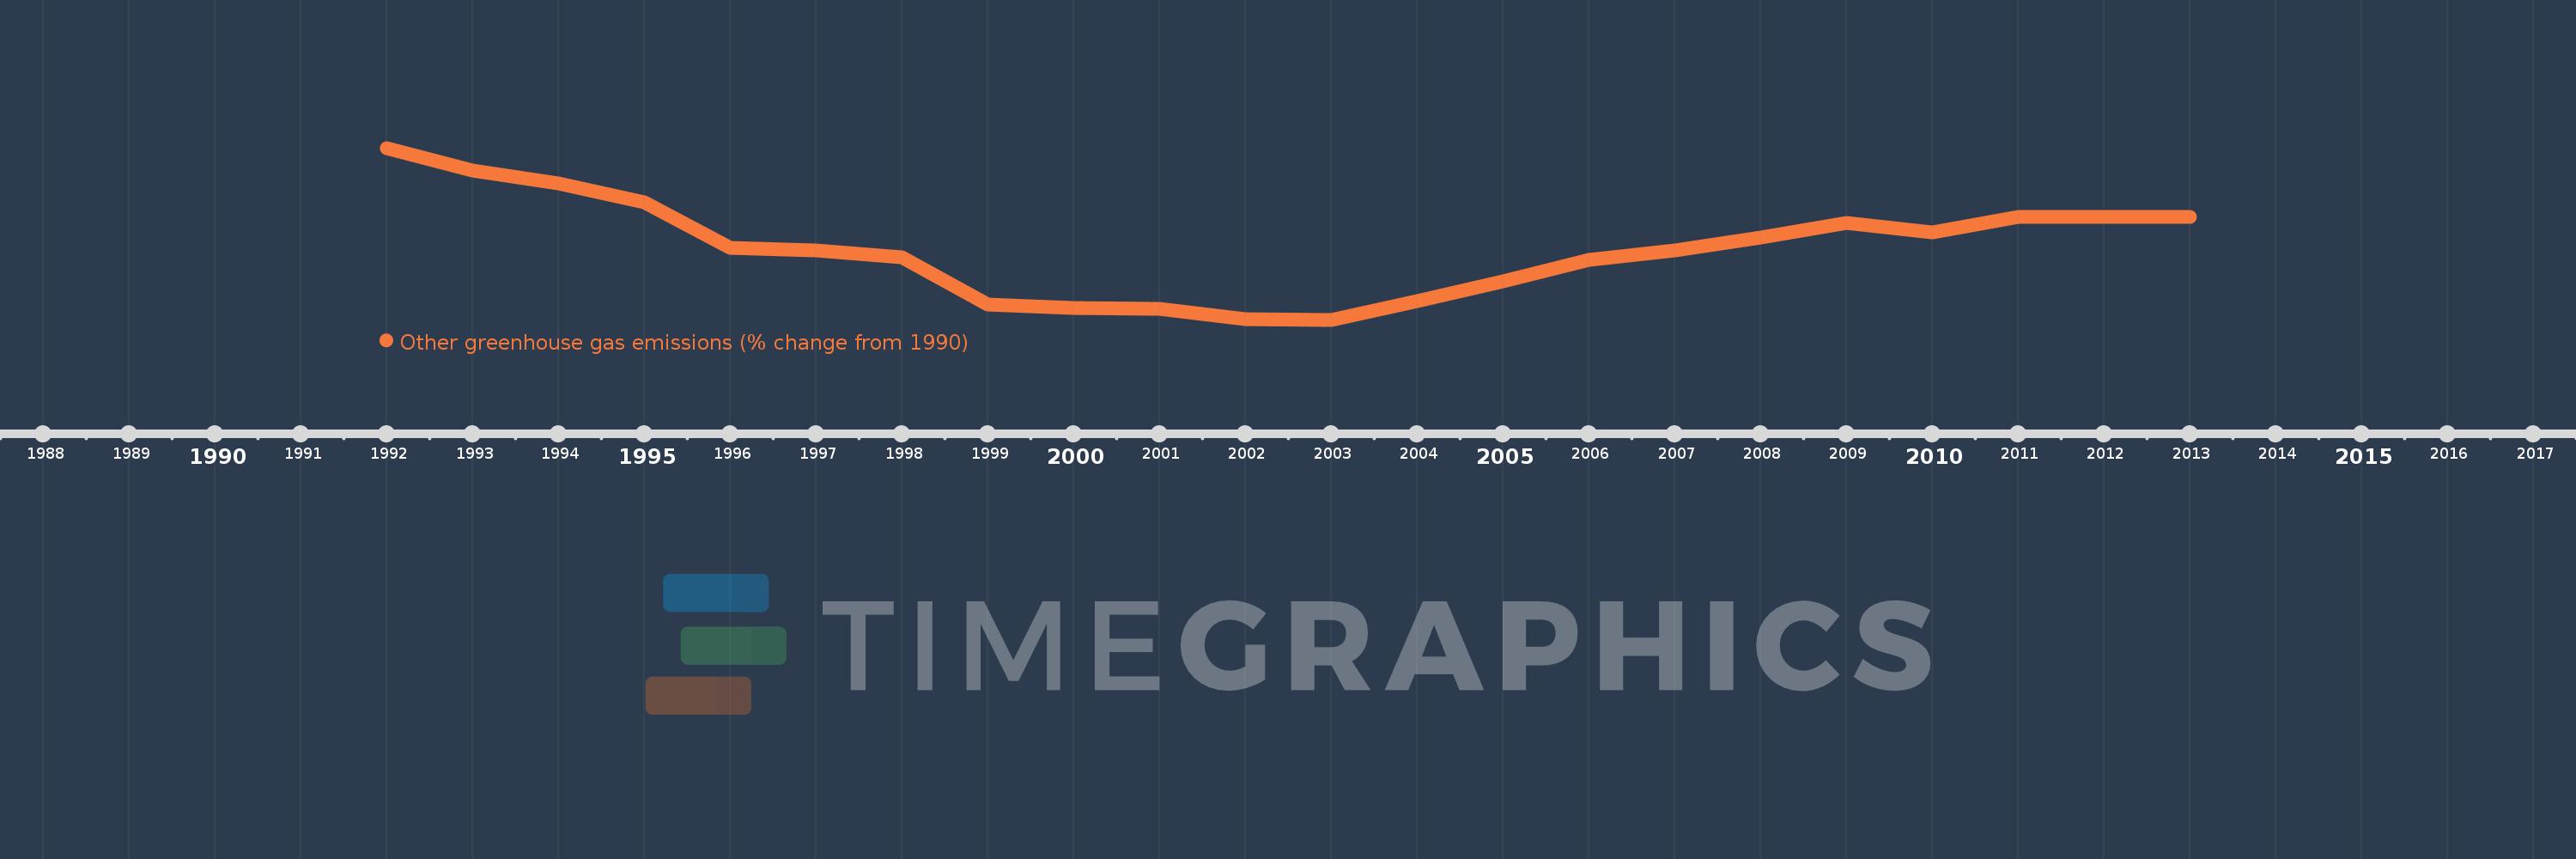
This timeline shows a graph from 1992 to 2013 of Slovenia. No data until 1991. Number of actual observations by date: 22.
Source name:
World Development Indicators
Source organization:
World Bank staff estimates from original source: European Commission, Joint Research Centre (JRC)/Netherlands Environmental Assessment Agency (PBL). Emission Database for Global Atmospheric Research (EDGAR): http://edgar.jrc.ec.europa.eu/.
Categories, topics:
Climate Change, Environment
Last updated:
apr 23, 2017
Indicators value changes by year
Meaning:
-46.235
Minimum:
-69.123
jan 1, 2003
Maximum:
-14.322
jan 1, 1992
At the date of observation
Value
Absolute change
Change from the previous value
jan 1, 1992
-14.322
-14.322
0.0%
jan 1, 1993
-21.394
-7.071
49.37%
jan 1, 1994
-25.522
-4.128
19.3%
jan 1, 1995
-31.692
-6.17
24.18%
jan 1, 1996
-46.155
-14.462
45.63%
jan 1, 1997
-46.915
-0.761
1.65%
jan 1, 1998
-49.319
-2.404
5.12%
jan 1, 1999
-64.361
-15.042
30.5%
jan 1, 2000
-65.247
-0.886
1.38%
jan 1, 2001
-65.773
-0.526
0.81%
jan 1, 2002
-68.841
-3.069
4.67%
jan 1, 2003
-69.123
-0.282
0.41%
jan 1, 2004
-63.088
+6.035
-8.73%
jan 1, 2005
-56.885
+6.204
-9.83%
jan 1, 2006
-50.067
+6.818
-11.99%
jan 1, 2007
-47.053
+3.014
-6.02%
jan 1, 2008
-42.946
+4.106
-8.73%
jan 1, 2009
-38.354
+4.593
-10.69%
jan 1, 2010
-41.19
-2.836
7.39%
jan 1, 2011
-36.31
+4.88
-11.85%
jan 1, 2012
-36.31
0.0
0.0%
jan 1, 2013
-36.31
+0.0
0.0%
Ranking of countries by current statistics by years