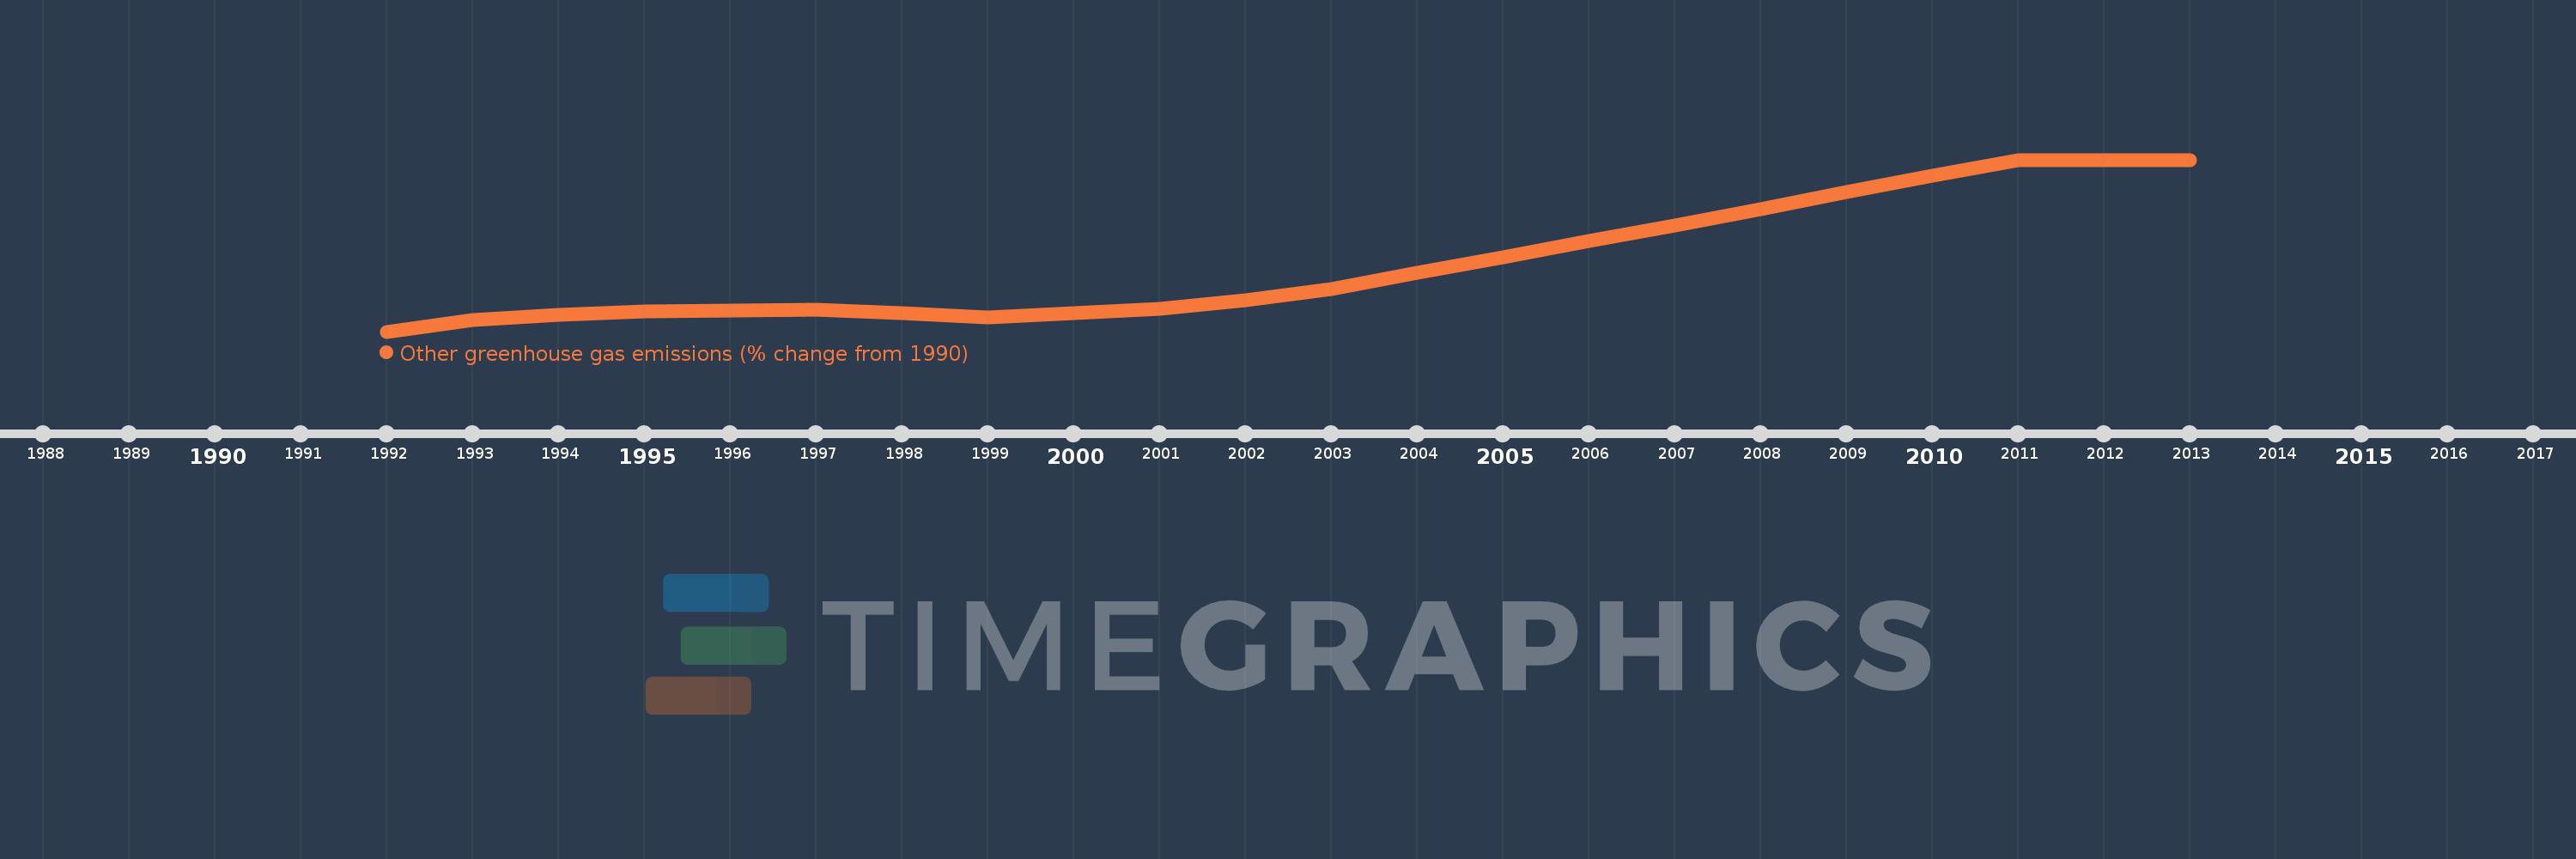
This timeline shows a graph from 1992 to 2013 of Kuwait. No data until 1991. Number of actual observations by date: 22.
Source name:
World Development Indicators
Source organization:
World Bank staff estimates from original source: European Commission, Joint Research Centre (JRC)/Netherlands Environmental Assessment Agency (PBL). Emission Database for Global Atmospheric Research (EDGAR): http://edgar.jrc.ec.europa.eu/.
Categories, topics:
Climate Change, Environment
Last updated:
apr 23, 2017
Indicators value changes by year
Meaning:
199.472
Minimum:
33.301
jan 1, 1992
Maximum:
451.403
jan 1, 2012
At the date of observation
Value
Absolute change
Change from the previous value
jan 1, 1992
33.301
+33.301
0.0%
jan 1, 1993
62.309
+29.007
87.11%
jan 1, 1994
73.876
+11.568
18.57%
jan 1, 1995
81.876
+7.999
10.83%
jan 1, 1996
85.562
+3.686
4.5%
jan 1, 1997
87.082
+1.52
1.78%
jan 1, 1998
77.467
-9.614
-11.04%
jan 1, 1999
68.157
-9.31
-12.02%
jan 1, 2000
77.467
+9.31
13.66%
jan 1, 2001
89.248
+11.78
15.21%
jan 1, 2002
109.389
+20.141
22.57%
jan 1, 2003
137.13
+27.741
25.36%
jan 1, 2004
175.891
+38.762
28.27%
jan 1, 2005
214.273
+38.382
21.82%
jan 1, 2006
253.415
+39.142
18.27%
jan 1, 2007
291.796
+38.382
15.15%
jan 1, 2008
332.078
+40.282
13.8%
jan 1, 2009
371.98
+39.902
12.02%
jan 1, 2010
411.881
+39.902
10.73%
jan 1, 2011
451.403
+39.522
9.6%
jan 1, 2012
451.403
+0.0
0.0%
jan 1, 2013
451.403
0.0
0.0%
Ranking of countries by current statistics by years