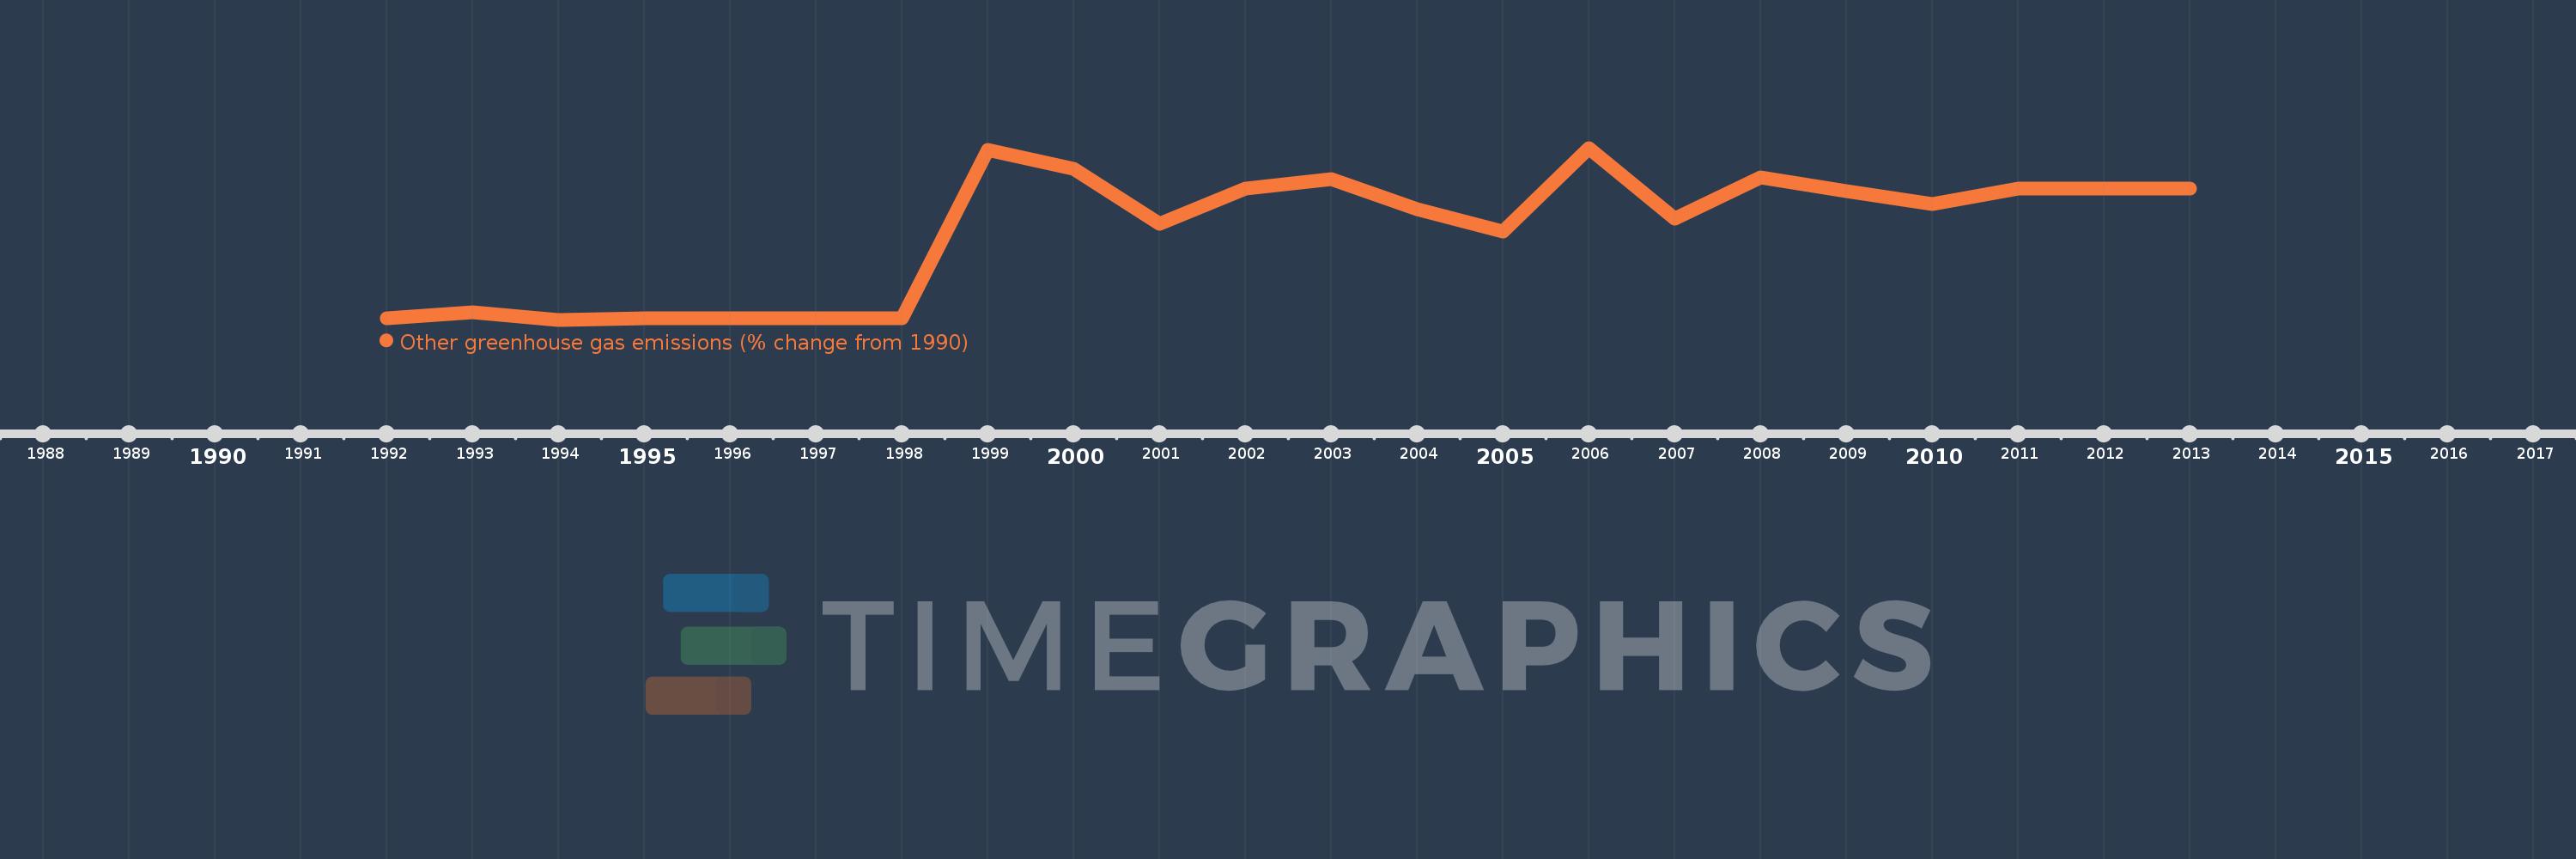
This timeline shows a graph from 1992 to 2013 of South Africa. No data until 1991. Number of actual observations by date: 22.
Source name:
World Development Indicators
Source organization:
World Bank staff estimates from original source: European Commission, Joint Research Centre (JRC)/Netherlands Environmental Assessment Agency (PBL). Emission Database for Global Atmospheric Research (EDGAR): http://edgar.jrc.ec.europa.eu/.
Categories, topics:
Climate Change, Environment
Last updated:
apr 23, 2017
Indicators value changes by year
Meaning:
594.426
Minimum:
-33.054
jan 1, 1994
Maximum:
1.178K
jan 1, 2006
At the date of observation
Value
Absolute change
Change from the previous value
jan 1, 1992
-21.748
-21.748
0.0%
jan 1, 1993
21.56
+43.308
-199.14%
jan 1, 1994
-33.054
-54.614
-253.31%
jan 1, 1995
-22.682
+10.372
-31.38%
jan 1, 1996
-20.193
+2.489
-10.97%
jan 1, 1997
-23.153
-2.96
14.66%
jan 1, 1998
-21.556
+1.597
-6.9%
jan 1, 1999
1.167K
+1.188K
-5.51K%
jan 1, 2000
1.031K
-135.618
-11.62%
jan 1, 2001
643.553
-387.738
-37.6%
jan 1, 2002
893.413
+249.86
38.83%
jan 1, 2003
960.938
+67.525
7.56%
jan 1, 2004
747.615
-213.323
-22.2%
jan 1, 2005
590.268
-157.347
-21.05%
jan 1, 2006
1.178K
+588.074
99.63%
jan 1, 2007
677.719
-500.624
-42.49%
jan 1, 2008
969.361
+291.643
43.03%
jan 1, 2009
872.194
-97.168
-10.02%
jan 1, 2010
782.842
-89.352
-10.24%
jan 1, 2011
894.583
+111.741
14.27%
jan 1, 2012
894.583
0.0
0.0%
jan 1, 2013
894.583
0.0
0.0%
Ranking of countries by current statistics by years