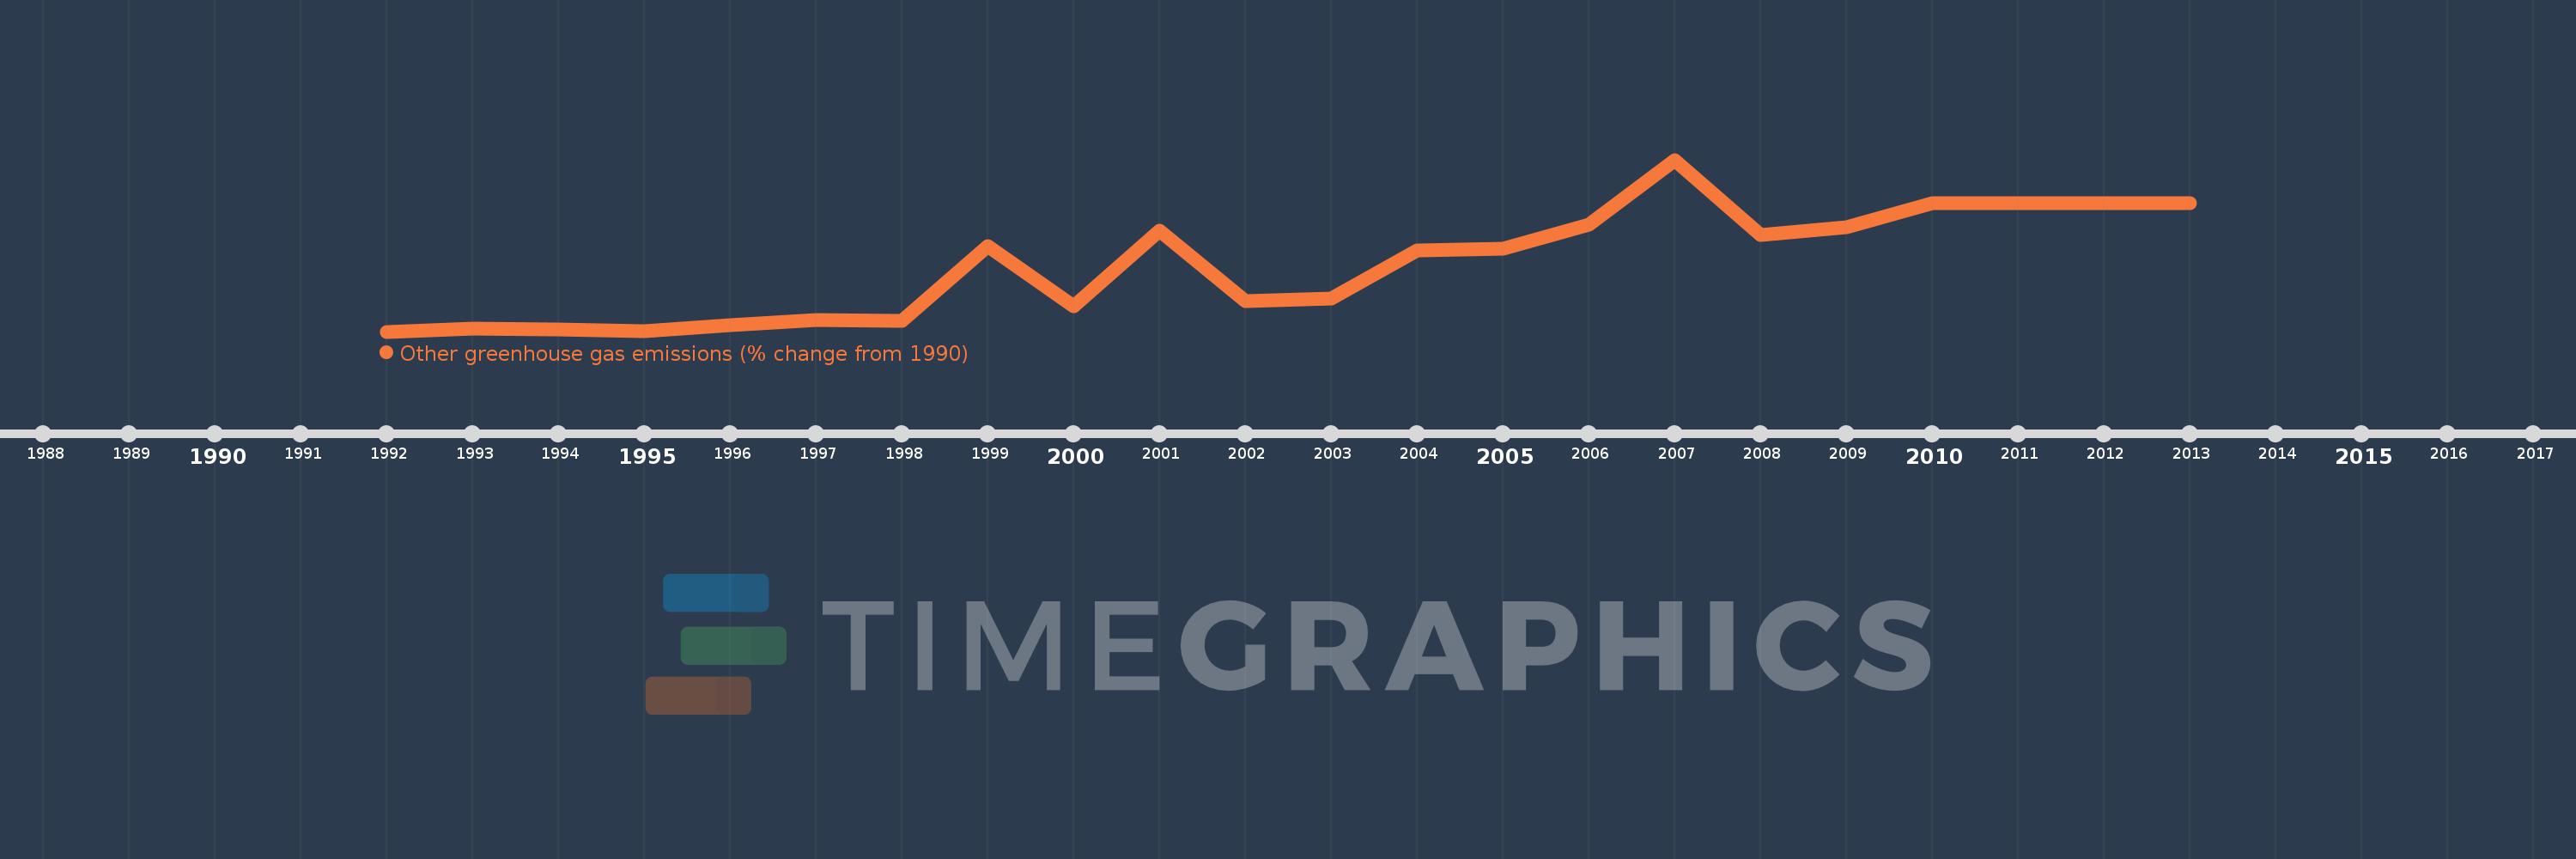
This timeline shows a graph from 1992 to 2013 of Spain. No data until 1991. Number of actual observations by date: 22.
Source name:
World Development Indicators
Source organization:
World Bank staff estimates from original source: European Commission, Joint Research Centre (JRC)/Netherlands Environmental Assessment Agency (PBL). Emission Database for Global Atmospheric Research (EDGAR): http://edgar.jrc.ec.europa.eu/.
Categories, topics:
Climate Change, Environment
Last updated:
apr 23, 2017
Indicators value changes by year
Meaning:
55.772
Minimum:
2.22
jan 1, 1992
Maximum:
140.167
jan 1, 2007
At the date of observation
Value
Absolute change
Change from the previous value
jan 1, 1992
2.22
+2.22
0.0%
jan 1, 1993
4.87
+2.65
119.4%
jan 1, 1994
3.693
-1.177
-24.17%
jan 1, 1995
2.899
-0.794
-21.51%
jan 1, 1996
7.239
+4.341
149.76%
jan 1, 1997
11.867
+4.628
63.93%
jan 1, 1998
11.057
-0.81
-6.83%
jan 1, 1999
71.114
+60.057
543.16%
jan 1, 2000
22.358
-48.756
-68.56%
jan 1, 2001
82.996
+60.637
271.21%
jan 1, 2002
26.652
-56.343
-67.89%
jan 1, 2003
28.663
+2.011
7.54%
jan 1, 2004
67.109
+38.446
134.13%
jan 1, 2005
69.058
+1.949
2.9%
jan 1, 2006
87.965
+18.907
27.38%
jan 1, 2007
140.167
+52.202
59.34%
jan 1, 2008
79.794
-60.373
-43.07%
jan 1, 2009
85.731
+5.936
7.44%
jan 1, 2010
105.038
+19.307
22.52%
jan 1, 2011
105.499
+0.461
0.44%
jan 1, 2012
105.499
0.0
0.0%
jan 1, 2013
105.499
+0.0
0.0%
Ranking of countries by current statistics by years