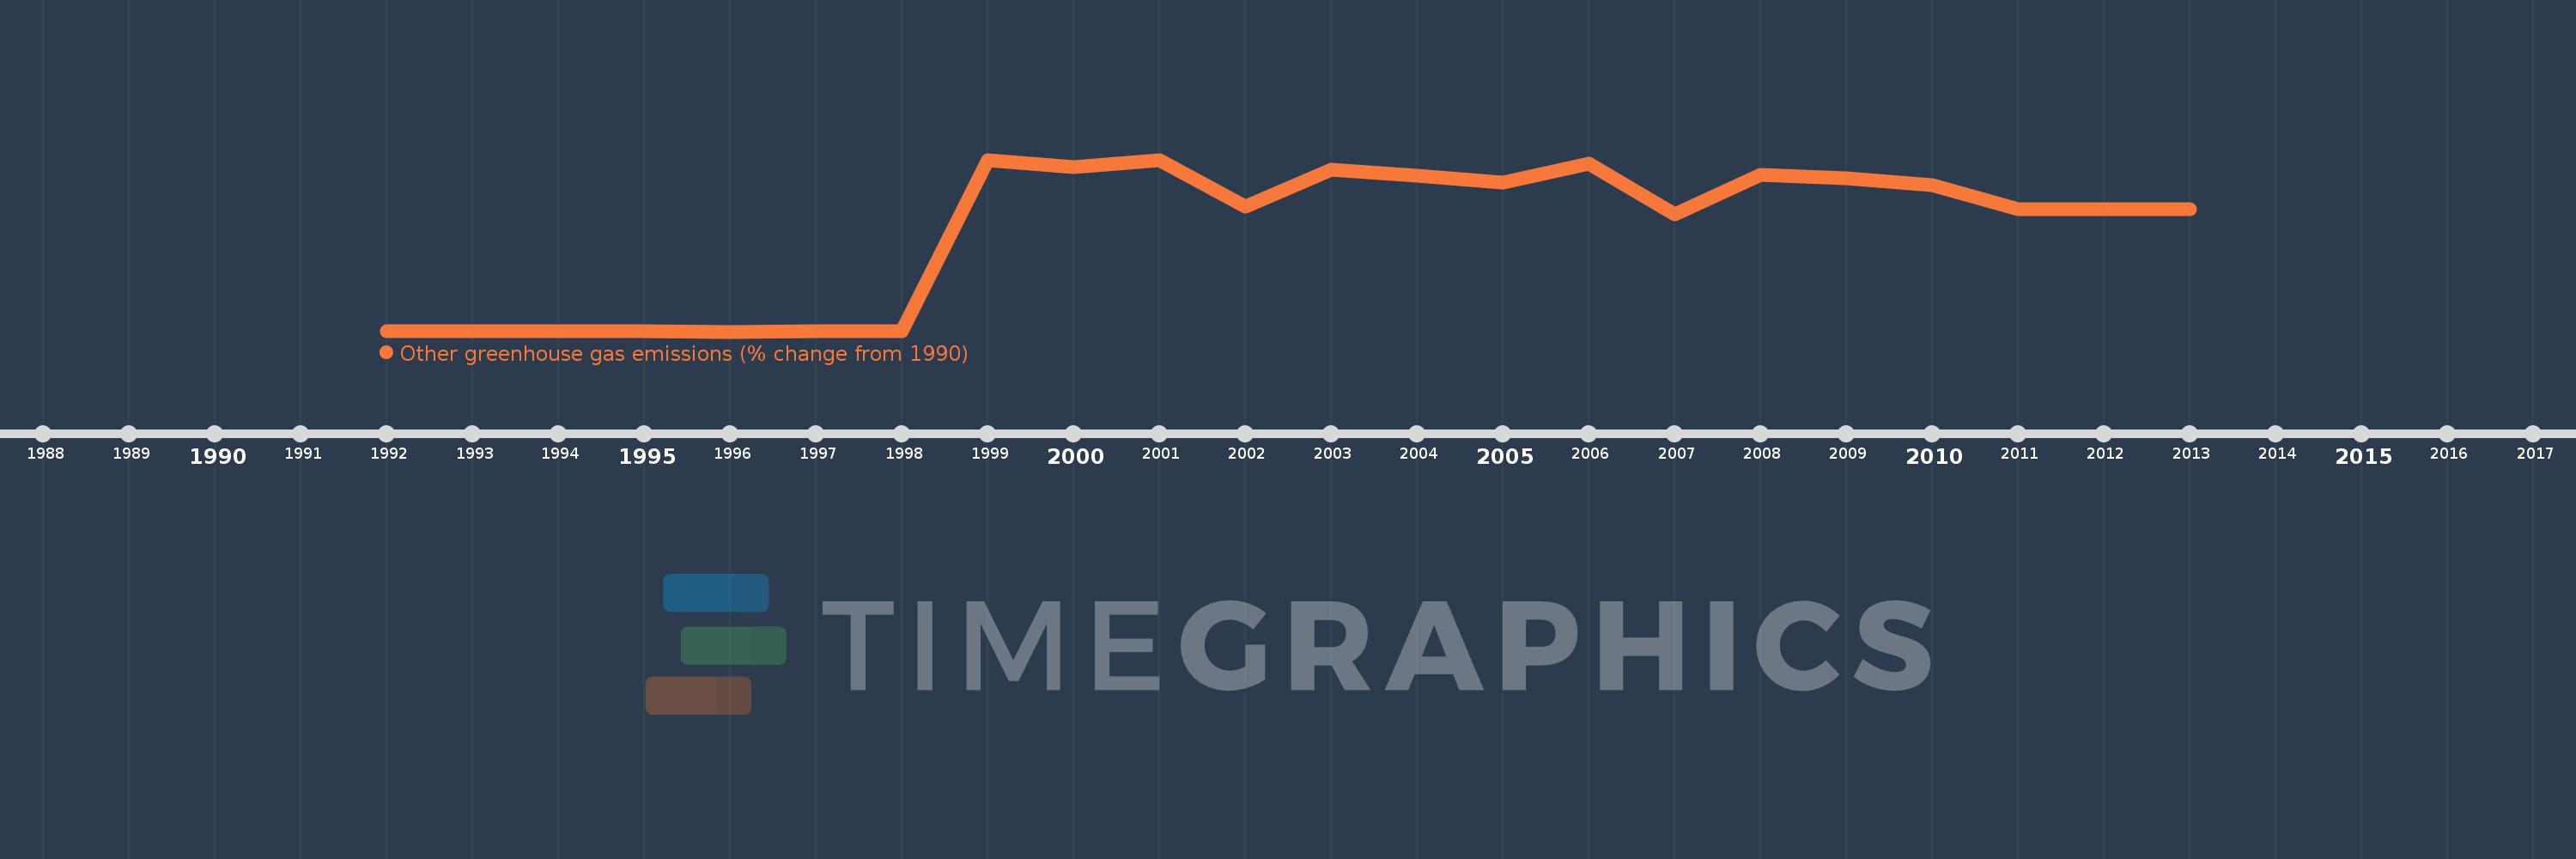
This timeline shows a graph from 1992 to 2013 of Arab World. No data until 1991. Number of actual observations by date: 22.
Source name:
World Development Indicators
Source organization:
World Bank staff estimates from original source: European Commission, Joint Research Centre (JRC)/Netherlands Environmental Assessment Agency (PBL). Emission Database for Global Atmospheric Research (EDGAR): http://edgar.jrc.ec.europa.eu/.
Categories, topics:
Climate Change, Environment
Last updated:
apr 23, 2017
Indicators value changes by year
Meaning:
756.458
Minimum:
-6.414
jan 1, 1996
Maximum:
1.299K
jan 1, 2001
At the date of observation
Value
Absolute change
Change from the previous value
jan 1, 1992
-5.067
-5.067
0.0%
jan 1, 1993
-4.464
+0.603
-11.9%
jan 1, 1994
-4.966
-0.502
11.24%
jan 1, 1995
-5.86
-0.894
18.01%
jan 1, 1996
-6.414
-0.554
9.45%
jan 1, 1997
-3.046
+3.368
-52.51%
jan 1, 1998
-2.493
+0.553
-18.16%
jan 1, 1999
1.297K
+1.3K
-52.13K%
jan 1, 2000
1.241K
-55.805
-4.3%
jan 1, 2001
1.299K
+57.647
4.64%
jan 1, 2002
939.935
-358.917
-27.63%
jan 1, 2003
1.225K
+285.081
30.33%
jan 1, 2004
1.175K
-49.725
-4.06%
jan 1, 2005
1.128K
-46.805
-3.98%
jan 1, 2006
1.272K
+143.106
12.68%
jan 1, 2007
882.853
-388.74
-30.57%
jan 1, 2008
1.185K
+301.894
34.2%
jan 1, 2009
1.157K
-28.121
-2.37%
jan 1, 2010
1.107K
-49.301
-4.26%
jan 1, 2011
921.814
-185.51
-16.75%
jan 1, 2012
921.814
0.0
0.0%
jan 1, 2013
921.814
+0.0
0.0%
Ranking of countries by current statistics by years