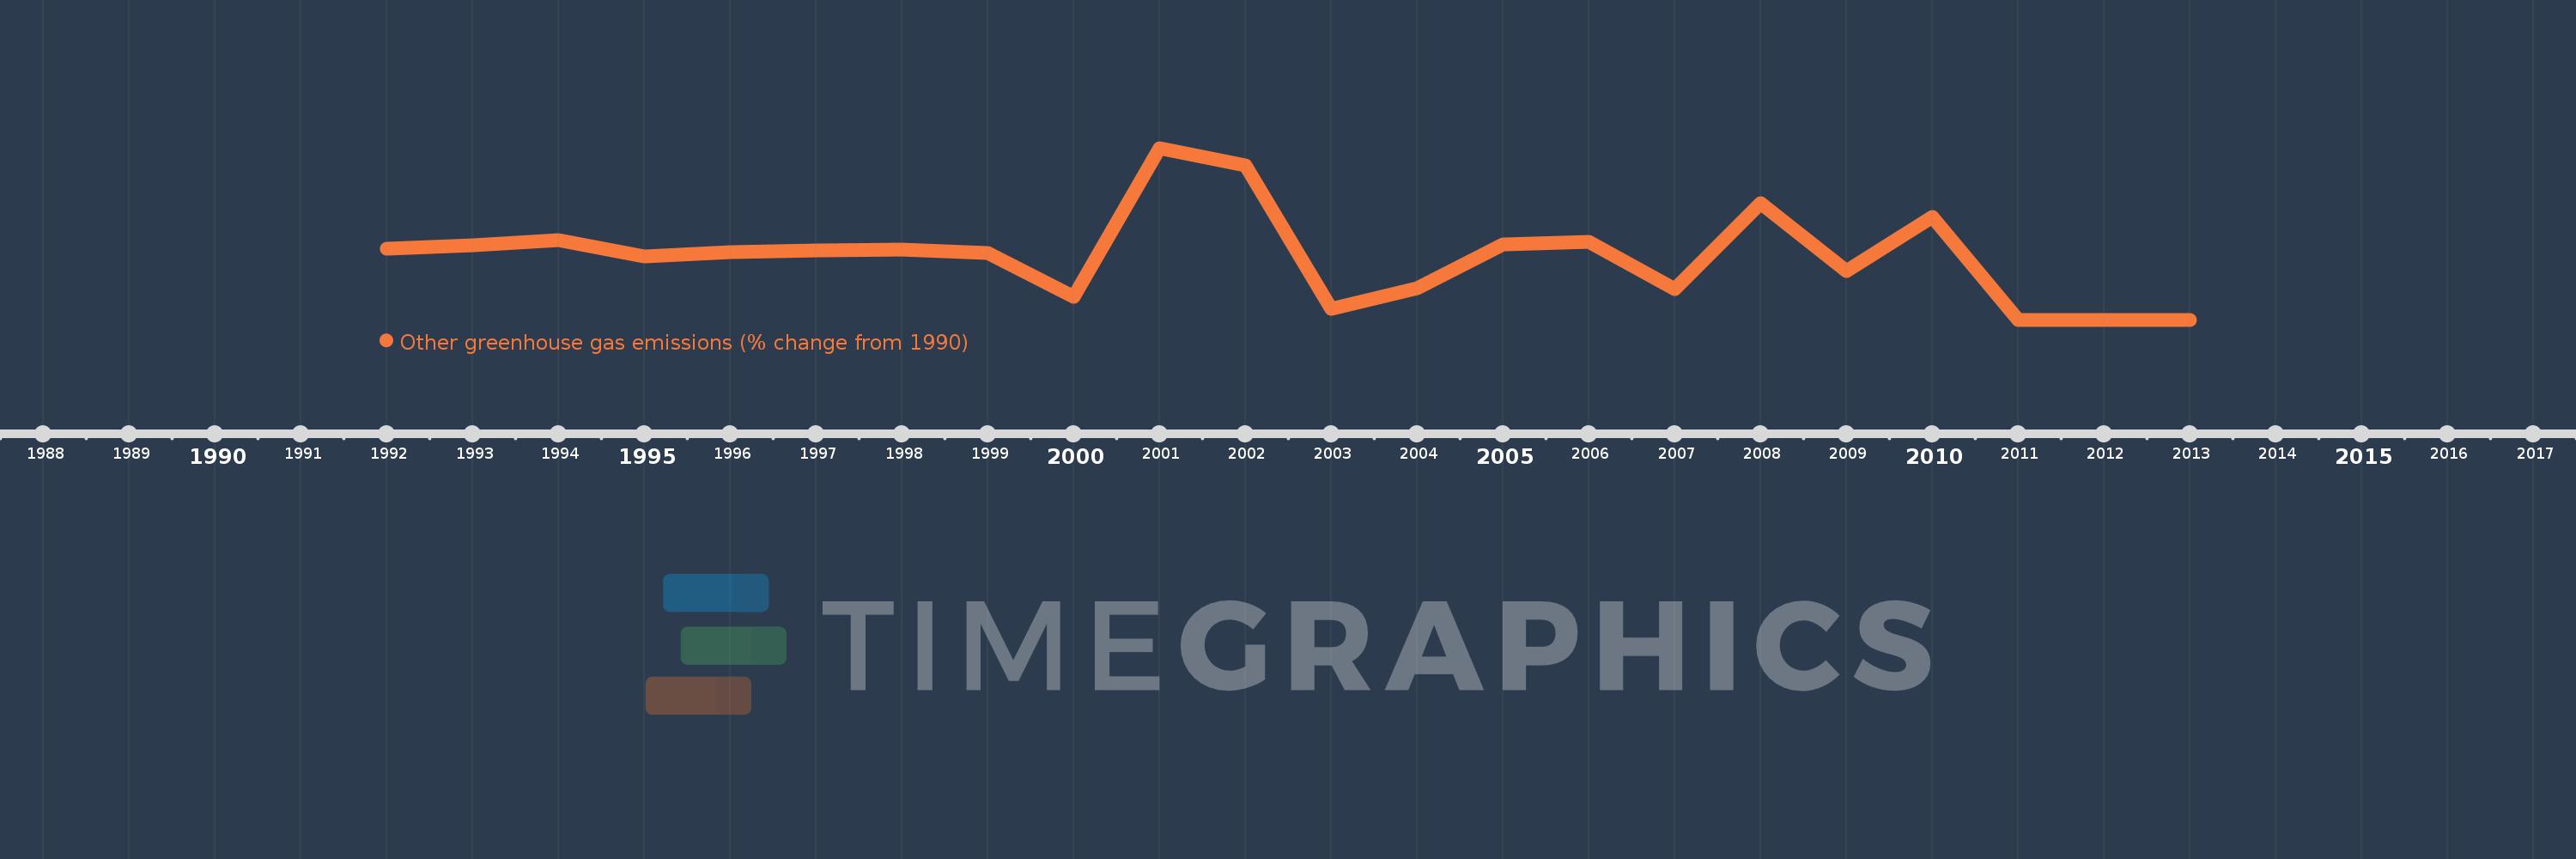
This timeline shows a graph from 1992 to 2013 of Ecuador. No data until 1991. Number of actual observations by date: 22.
Source name:
World Development Indicators
Source organization:
World Bank staff estimates from original source: European Commission, Joint Research Centre (JRC)/Netherlands Environmental Assessment Agency (PBL). Emission Database for Global Atmospheric Research (EDGAR): http://edgar.jrc.ec.europa.eu/.
Categories, topics:
Climate Change, Environment
Last updated:
apr 23, 2017
Indicators value changes by year
Meaning:
-11.819
Minimum:
-84.835
jan 1, 2011
Maximum:
111.753
jan 1, 2001
At the date of observation
Value
Absolute change
Change from the previous value
jan 1, 1992
-3.206
-3.206
0.0%
jan 1, 1993
0.383
+3.589
-111.96%
jan 1, 1994
5.936
+5.552
1.45K%
jan 1, 1995
-12.636
-18.571
-312.87%
jan 1, 1996
-7.779
+4.857
-38.44%
jan 1, 1997
-5.817
+1.962
-25.22%
jan 1, 1998
-4.911
+0.906
-15.57%
jan 1, 1999
-8.904
-3.993
81.3%
jan 1, 2000
-58.924
-50.02
561.79%
jan 1, 2001
111.753
+170.676
-289.66%
jan 1, 2002
91.957
-19.795
-17.71%
jan 1, 2003
-71.926
-163.884
-178.22%
jan 1, 2004
-49.192
+22.735
-31.61%
jan 1, 2005
1.285
+50.477
-102.61%
jan 1, 2006
4.251
+2.966
230.76%
jan 1, 2007
-49.976
-54.227
-1.28K%
jan 1, 2008
48.141
+98.117
-196.33%
jan 1, 2009
-28.97
-77.111
-160.18%
jan 1, 2010
33.012
+61.982
-213.95%
jan 1, 2011
-84.835
-117.846
-356.98%
jan 1, 2012
-84.835
+0.0
0.0%
jan 1, 2013
-84.835
+0.0
0.0%
Ranking of countries by current statistics by years