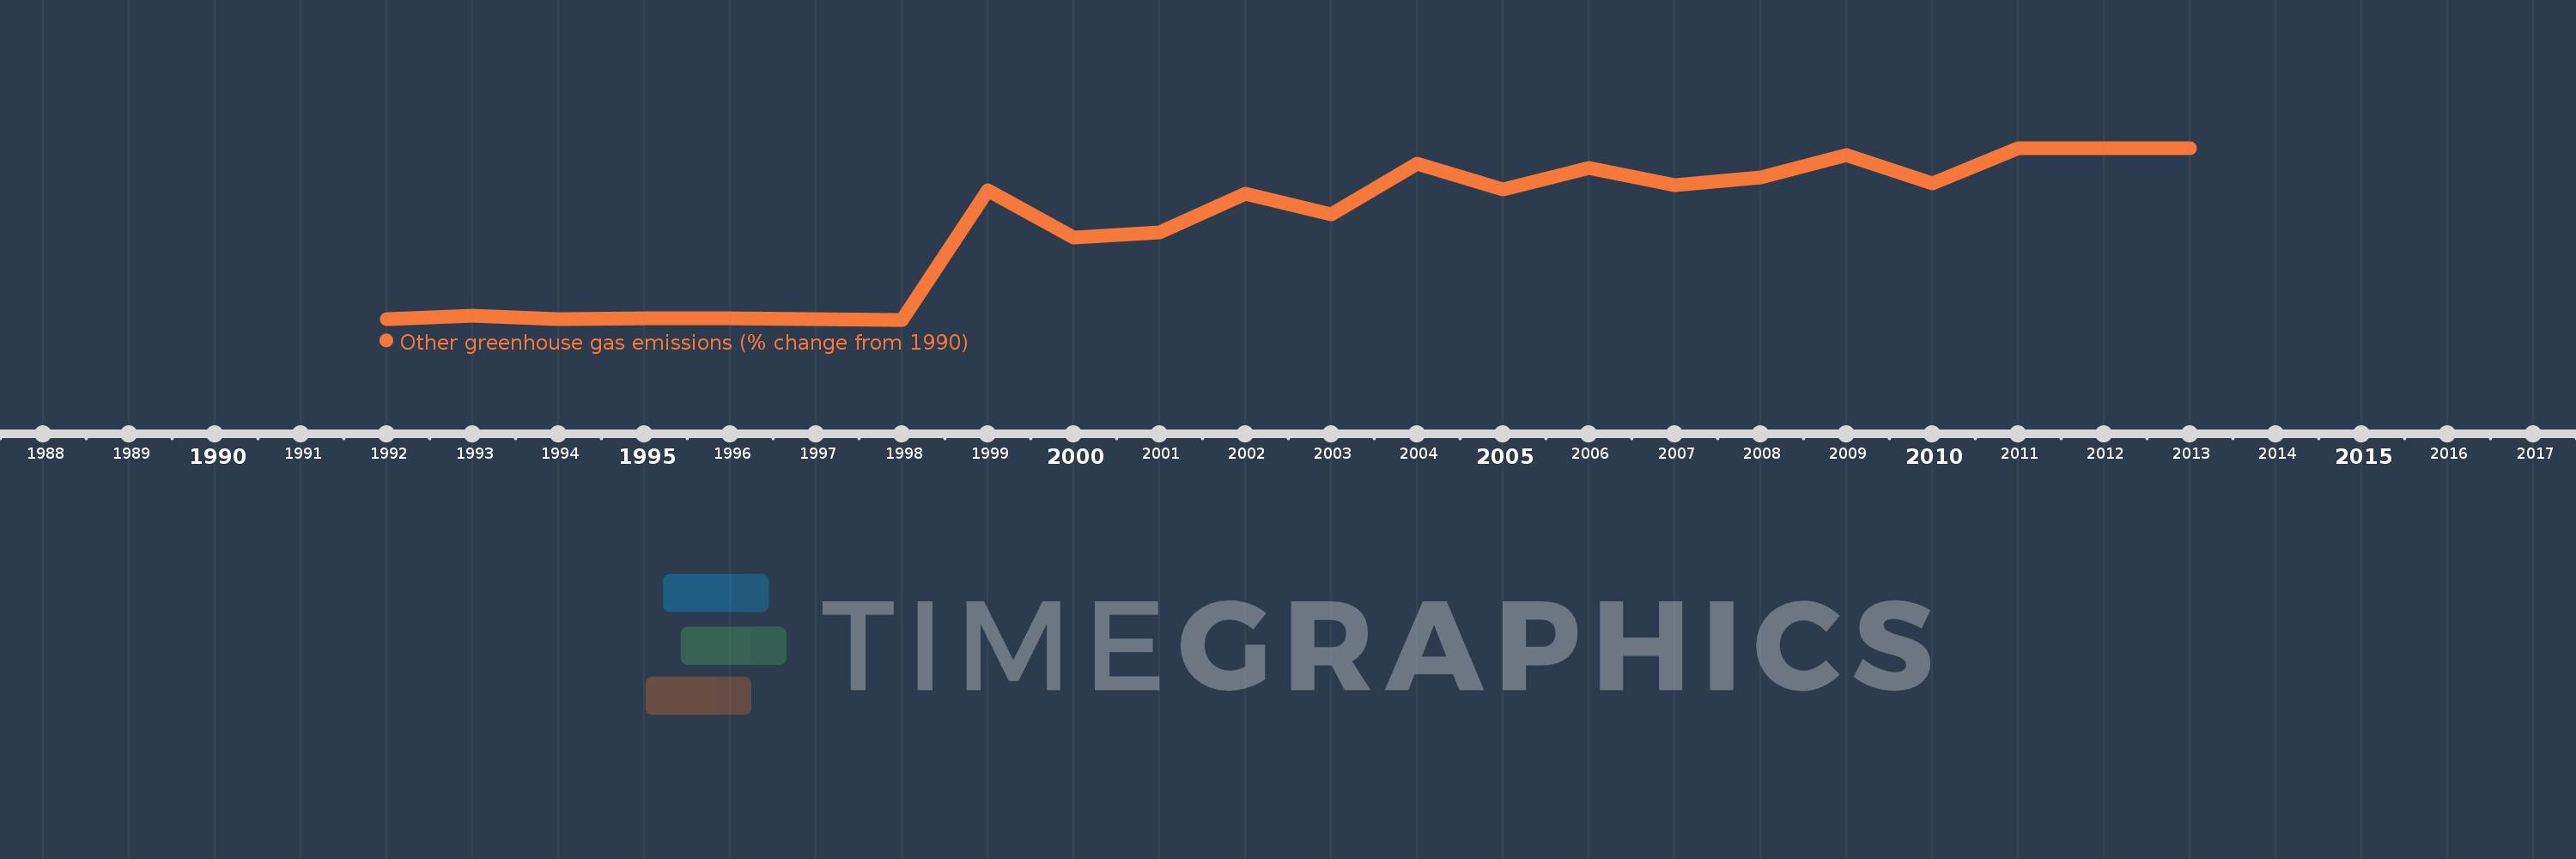
This timeline shows a graph from 1992 to 2013 of Mozambique. No data until 1991. Number of actual observations by date: 22.
Source name:
World Development Indicators
Source organization:
World Bank staff estimates from original source: European Commission, Joint Research Centre (JRC)/Netherlands Environmental Assessment Agency (PBL). Emission Database for Global Atmospheric Research (EDGAR): http://edgar.jrc.ec.europa.eu/.
Categories, topics:
Climate Change, Environment
Last updated:
apr 23, 2017
Indicators value changes by year
Meaning:
1.083K
Minimum:
-20.983
jan 1, 1998
Maximum:
1.996K
jan 1, 2011
At the date of observation
Value
Absolute change
Change from the previous value
jan 1, 1992
-12.827
-12.827
0.0%
jan 1, 1993
25.942
+38.768
-302.25%
jan 1, 1994
-17.898
-43.84
-168.99%
jan 1, 1995
-8.294
+9.604
-53.66%
jan 1, 1996
-7.661
+0.633
-7.63%
jan 1, 1997
-18.017
-10.356
135.17%
jan 1, 1998
-20.983
-2.966
16.46%
jan 1, 1999
1.499K
+1.52K
-7.25K%
jan 1, 2000
948.904
-550.571
-36.72%
jan 1, 2001
999.417
+50.513
5.32%
jan 1, 2002
1.454K
+454.992
45.53%
jan 1, 2003
1.212K
-242.205
-16.65%
jan 1, 2004
1.807K
+595.245
49.1%
jan 1, 2005
1.507K
-300.916
-16.65%
jan 1, 2006
1.765K
+258.195
17.14%
jan 1, 2007
1.56K
-205.029
-11.62%
jan 1, 2008
1.649K
+89.579
5.74%
jan 1, 2009
1.912K
+263.003
15.95%
jan 1, 2010
1.582K
-330.127
-17.26%
jan 1, 2011
1.996K
+413.449
26.13%
jan 1, 2012
1.996K
0.0
0.0%
jan 1, 2013
1.996K
0.0
0.0%
Ranking of countries by current statistics by years