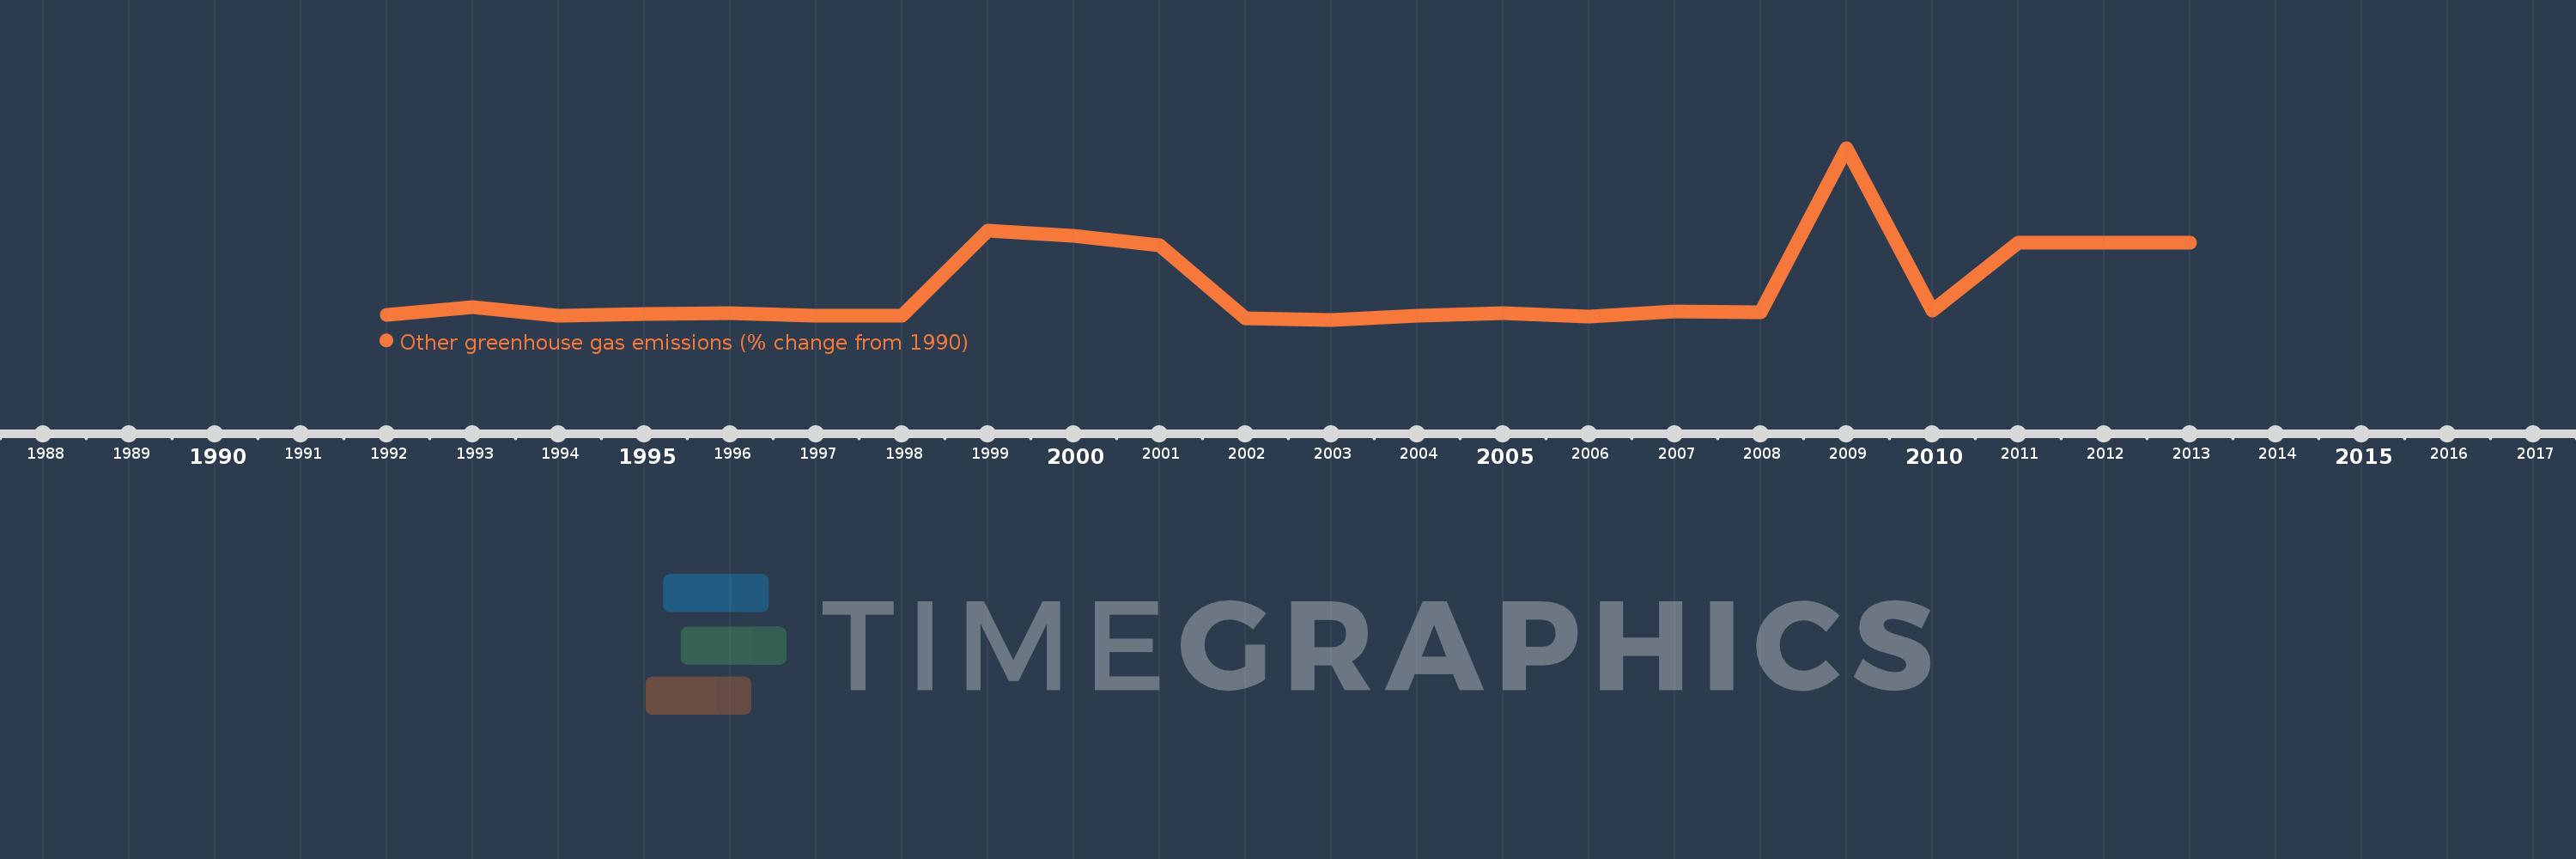
This timeline shows a graph from 1992 to 2013 of Gabon. No data until 1991. Number of actual observations by date: 22.
Source name:
World Development Indicators
Source organization:
World Bank staff estimates from original source: European Commission, Joint Research Centre (JRC)/Netherlands Environmental Assessment Agency (PBL). Emission Database for Global Atmospheric Research (EDGAR): http://edgar.jrc.ec.europa.eu/.
Categories, topics:
Climate Change, Environment
Last updated:
apr 23, 2017
Indicators value changes by year
Meaning:
173.304
Minimum:
-51.014
jan 1, 2003
Maximum:
1.103K
jan 1, 2009
At the date of observation
Value
Absolute change
Change from the previous value
jan 1, 1992
-15.414
-15.414
0.0%
jan 1, 1993
31.025
+46.439
-301.28%
jan 1, 1994
-21.468
-52.493
-169.2%
jan 1, 1995
-9.984
+11.484
-53.49%
jan 1, 1996
-9.253
+0.731
-7.32%
jan 1, 1997
-21.681
-12.428
134.31%
jan 1, 1998
-25.284
-3.603
16.62%
jan 1, 1999
545.857
+571.141
-2.26K%
jan 1, 2000
515.795
-30.061
-5.51%
jan 1, 2001
451.653
-64.142
-12.44%
jan 1, 2002
-39.428
-491.081
-108.73%
jan 1, 2003
-51.014
-11.586
29.38%
jan 1, 2004
-23.064
+27.95
-54.79%
jan 1, 2005
-4.355
+18.709
-81.12%
jan 1, 2006
-27.124
-22.769
522.8%
jan 1, 2007
7.215
+34.338
-126.6%
jan 1, 2008
-0.708
-7.923
-109.82%
jan 1, 2009
1.103K
+1.104K
-155.85K%
jan 1, 2010
8.273
-1.095K
-99.25%
jan 1, 2011
466.069
+457.797
5.53K%
jan 1, 2012
466.069
0.0
0.0%
jan 1, 2013
466.069
0.0
0.0%
Ranking of countries by current statistics by years