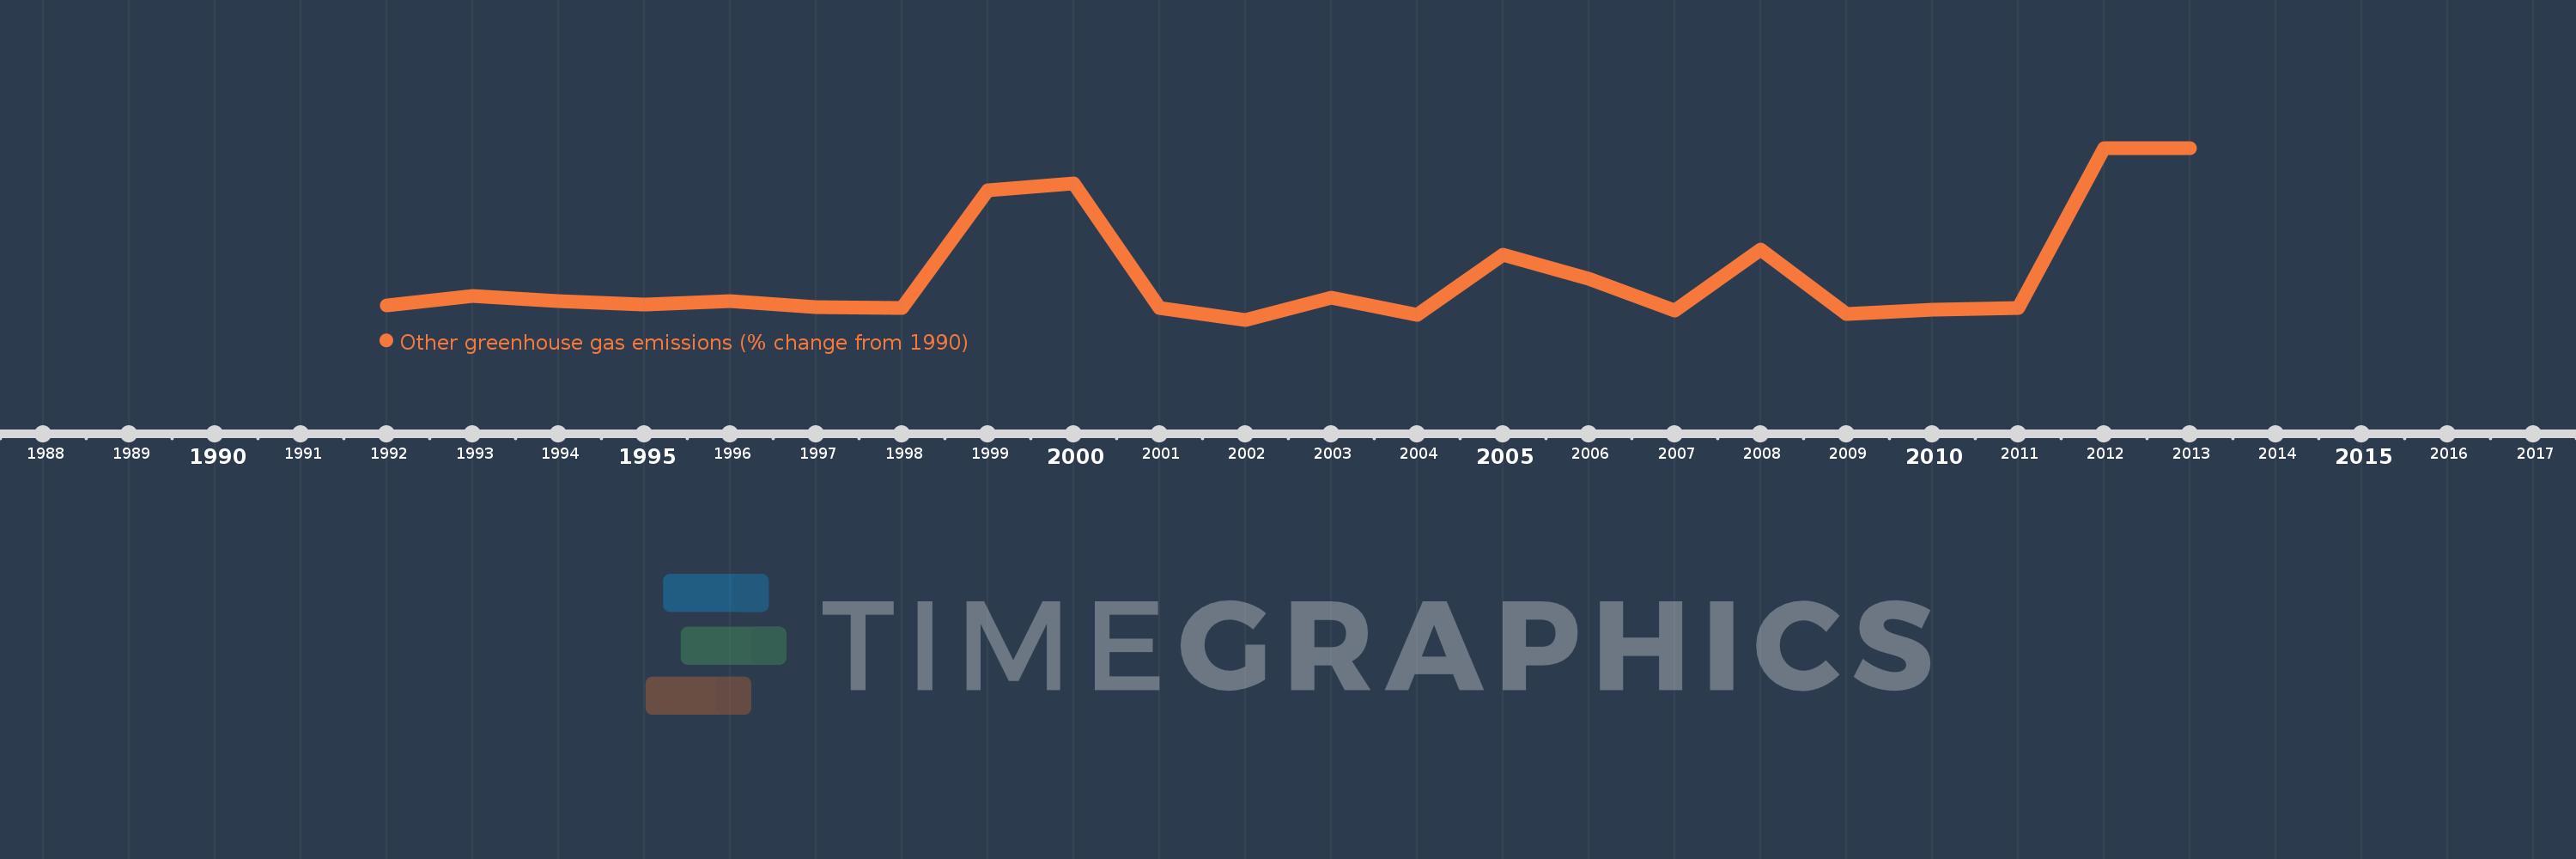
This timeline shows a graph from 1992 to 2013 of Lao PDR. No data until 1991. Number of actual observations by date: 22.
Source name:
World Development Indicators
Source organization:
World Bank staff estimates from original source: European Commission, Joint Research Centre (JRC)/Netherlands Environmental Assessment Agency (PBL). Emission Database for Global Atmospheric Research (EDGAR): http://edgar.jrc.ec.europa.eu/.
Categories, topics:
Climate Change, Environment
Last updated:
apr 23, 2017
Indicators value changes by year
Meaning:
123.31
Minimum:
-75.07
jan 1, 2002
Maximum:
691.893
jan 1, 2012
At the date of observation
Value
Absolute change
Change from the previous value
jan 1, 1992
-10.949
-10.949
0.0%
jan 1, 1993
31.96
+42.909
-391.89%
jan 1, 1994
7.318
-24.642
-77.1%
jan 1, 1995
-6.376
-13.693
-187.13%
jan 1, 1996
7.318
+13.693
-214.77%
jan 1, 1997
-20.069
-27.386
-374.25%
jan 1, 1998
-20.983
-0.915
4.56%
jan 1, 1999
503.996
+524.98
-2.5K%
jan 1, 2000
532.202
+28.206
5.6%
jan 1, 2001
-21.367
-553.569
-104.01%
jan 1, 2002
-75.07
-53.703
251.34%
jan 1, 2003
24.495
+99.565
-132.63%
jan 1, 2004
-53.155
-77.649
-317.0%
jan 1, 2005
215.939
+269.093
-506.25%
jan 1, 2006
106.646
-109.292
-50.61%
jan 1, 2007
-32.553
-139.199
-130.52%
jan 1, 2008
239.301
+271.854
-835.11%
jan 1, 2009
-48.977
-288.278
-120.47%
jan 1, 2010
-29.823
+19.154
-39.11%
jan 1, 2011
-20.811
+9.012
-30.22%
jan 1, 2012
691.893
+712.704
-3.42K%
jan 1, 2013
691.893
0.0
0.0%
Ranking of countries by current statistics by years