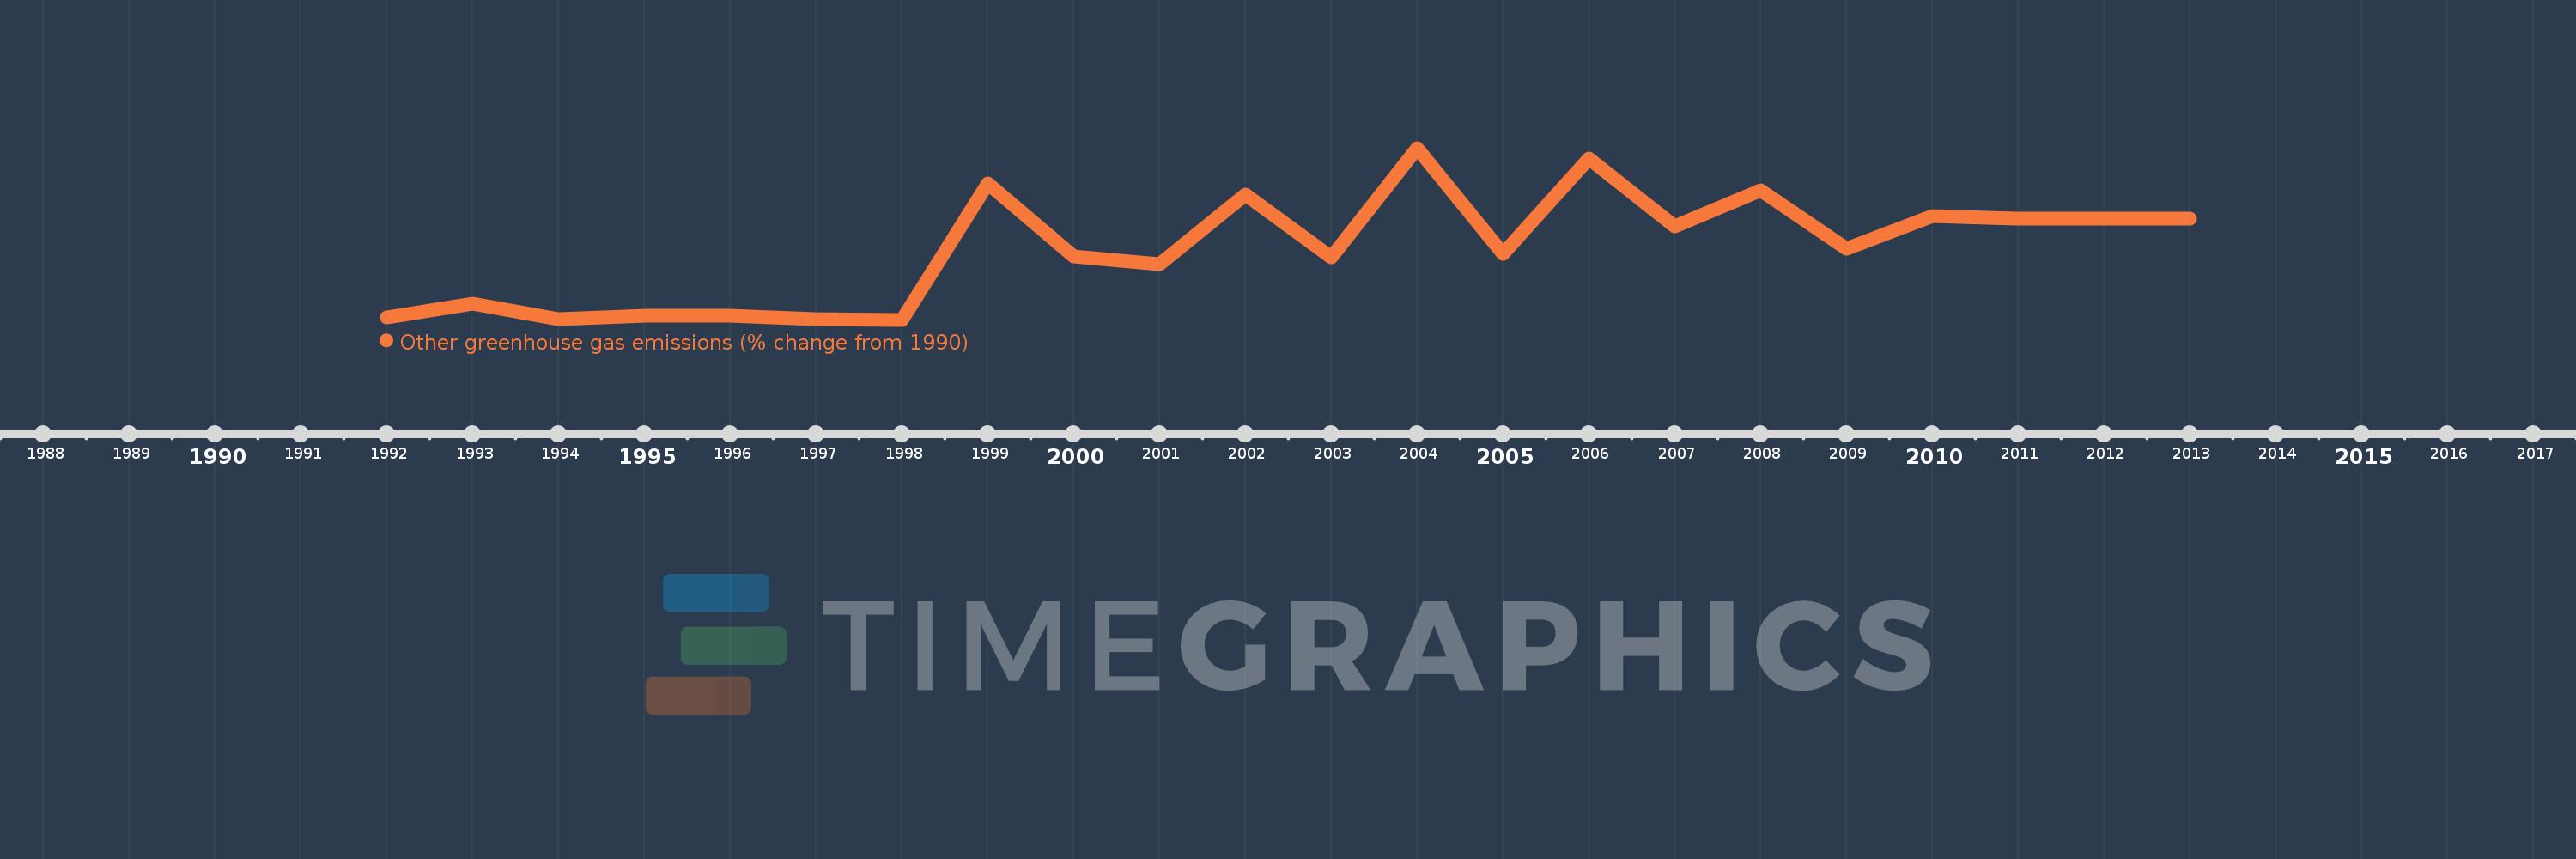
This timeline shows a graph from 1992 to 2013 of Madagascar. No data until 1991. Number of actual observations by date: 22.
Source name:
World Development Indicators
Source organization:
World Bank staff estimates from original source: European Commission, Joint Research Centre (JRC)/Netherlands Environmental Assessment Agency (PBL). Emission Database for Global Atmospheric Research (EDGAR): http://edgar.jrc.ec.europa.eu/.
Categories, topics:
Climate Change, Environment
Last updated:
apr 23, 2017
Indicators value changes by year
Meaning:
210.033
Minimum:
-22.732
jan 1, 1998
Maximum:
537.127
jan 1, 2004
At the date of observation
Value
Absolute change
Change from the previous value
jan 1, 1992
-14.006
-14.006
0.0%
jan 1, 1993
28.416
+42.421
-302.89%
jan 1, 1994
-19.496
-47.912
-168.61%
jan 1, 1995
-8.941
+10.555
-54.14%
jan 1, 1996
-8.232
+0.709
-7.93%
jan 1, 1997
-19.519
-11.287
137.11%
jan 1, 1998
-22.732
-3.213
16.46%
jan 1, 1999
421.17
+443.903
-1.95K%
jan 1, 2000
182.952
-238.218
-56.56%
jan 1, 2001
159.755
-23.197
-12.68%
jan 1, 2002
383.846
+224.091
140.27%
jan 1, 2003
179.586
-204.26
-53.21%
jan 1, 2004
537.127
+357.541
199.09%
jan 1, 2005
191.045
-346.082
-64.43%
jan 1, 2006
503.107
+312.062
163.34%
jan 1, 2007
280.626
-222.481
-44.22%
jan 1, 2008
399.819
+119.193
42.47%
jan 1, 2009
207.466
-192.354
-48.11%
jan 1, 2010
314.619
+107.153
51.65%
jan 1, 2011
308.04
-6.578
-2.09%
jan 1, 2012
308.04
+0.0
0.0%
jan 1, 2013
308.04
0.0
0.0%
Ranking of countries by current statistics by years