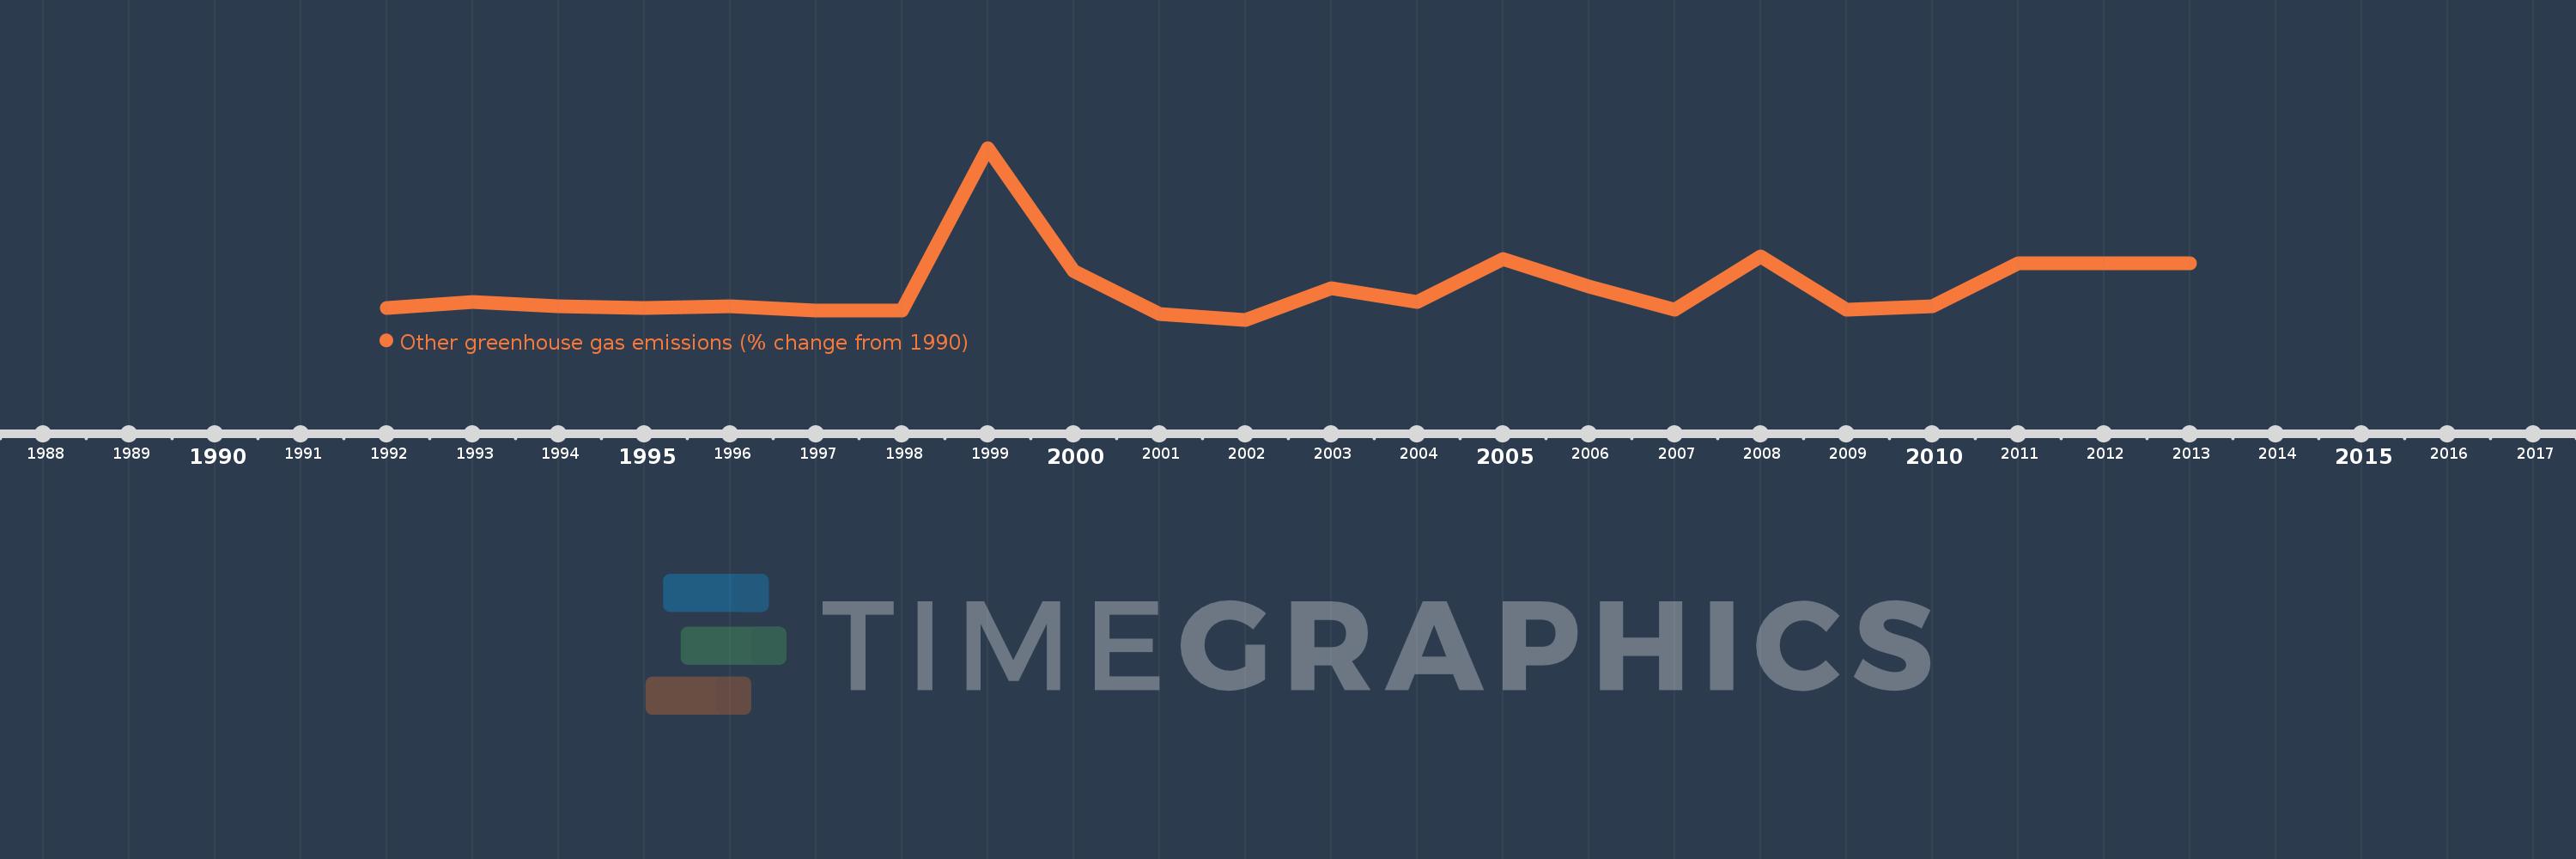
This timeline shows a graph from 1992 to 2013 of Thailand. No data until 1991. Number of actual observations by date: 22.
Source name:
World Development Indicators
Source organization:
World Bank staff estimates from original source: European Commission, Joint Research Centre (JRC)/Netherlands Environmental Assessment Agency (PBL). Emission Database for Global Atmospheric Research (EDGAR): http://edgar.jrc.ec.europa.eu/.
Categories, topics:
Climate Change, Environment
Last updated:
apr 23, 2017
Indicators value changes by year
Meaning:
104.025
Minimum:
-69.11
jan 1, 2002
Maximum:
836.376
jan 1, 1999
At the date of observation
Value
Absolute change
Change from the previous value
jan 1, 1992
-8.245
-8.245
0.0%
jan 1, 1993
23.898
+32.143
-389.86%
jan 1, 1994
4.027
-19.871
-83.15%
jan 1, 1995
-7.424
-11.451
-284.34%
jan 1, 1996
1.766
+9.19
-123.79%
jan 1, 1997
-19.682
-21.448
-1.21K%
jan 1, 1998
-21.305
-1.623
8.25%
jan 1, 1999
836.376
+857.681
-4.03K%
jan 1, 2000
188.412
-647.964
-77.47%
jan 1, 2001
-37.043
-225.455
-119.66%
jan 1, 2002
-69.11
-32.066
86.57%
jan 1, 2003
99.036
+168.146
-243.3%
jan 1, 2004
25.208
-73.828
-74.55%
jan 1, 2005
250.163
+224.955
892.4%
jan 1, 2006
104.572
-145.591
-58.2%
jan 1, 2007
-15.192
-119.764
-114.53%
jan 1, 2008
263.112
+278.304
-1.83K%
jan 1, 2009
-15.932
-279.044
-106.06%
jan 1, 2010
3.246
+19.178
-120.37%
jan 1, 2011
227.555
+224.309
6.91K%
jan 1, 2012
227.555
0.0
0.0%
jan 1, 2013
227.555
0.0
0.0%
Ranking of countries by current statistics by years