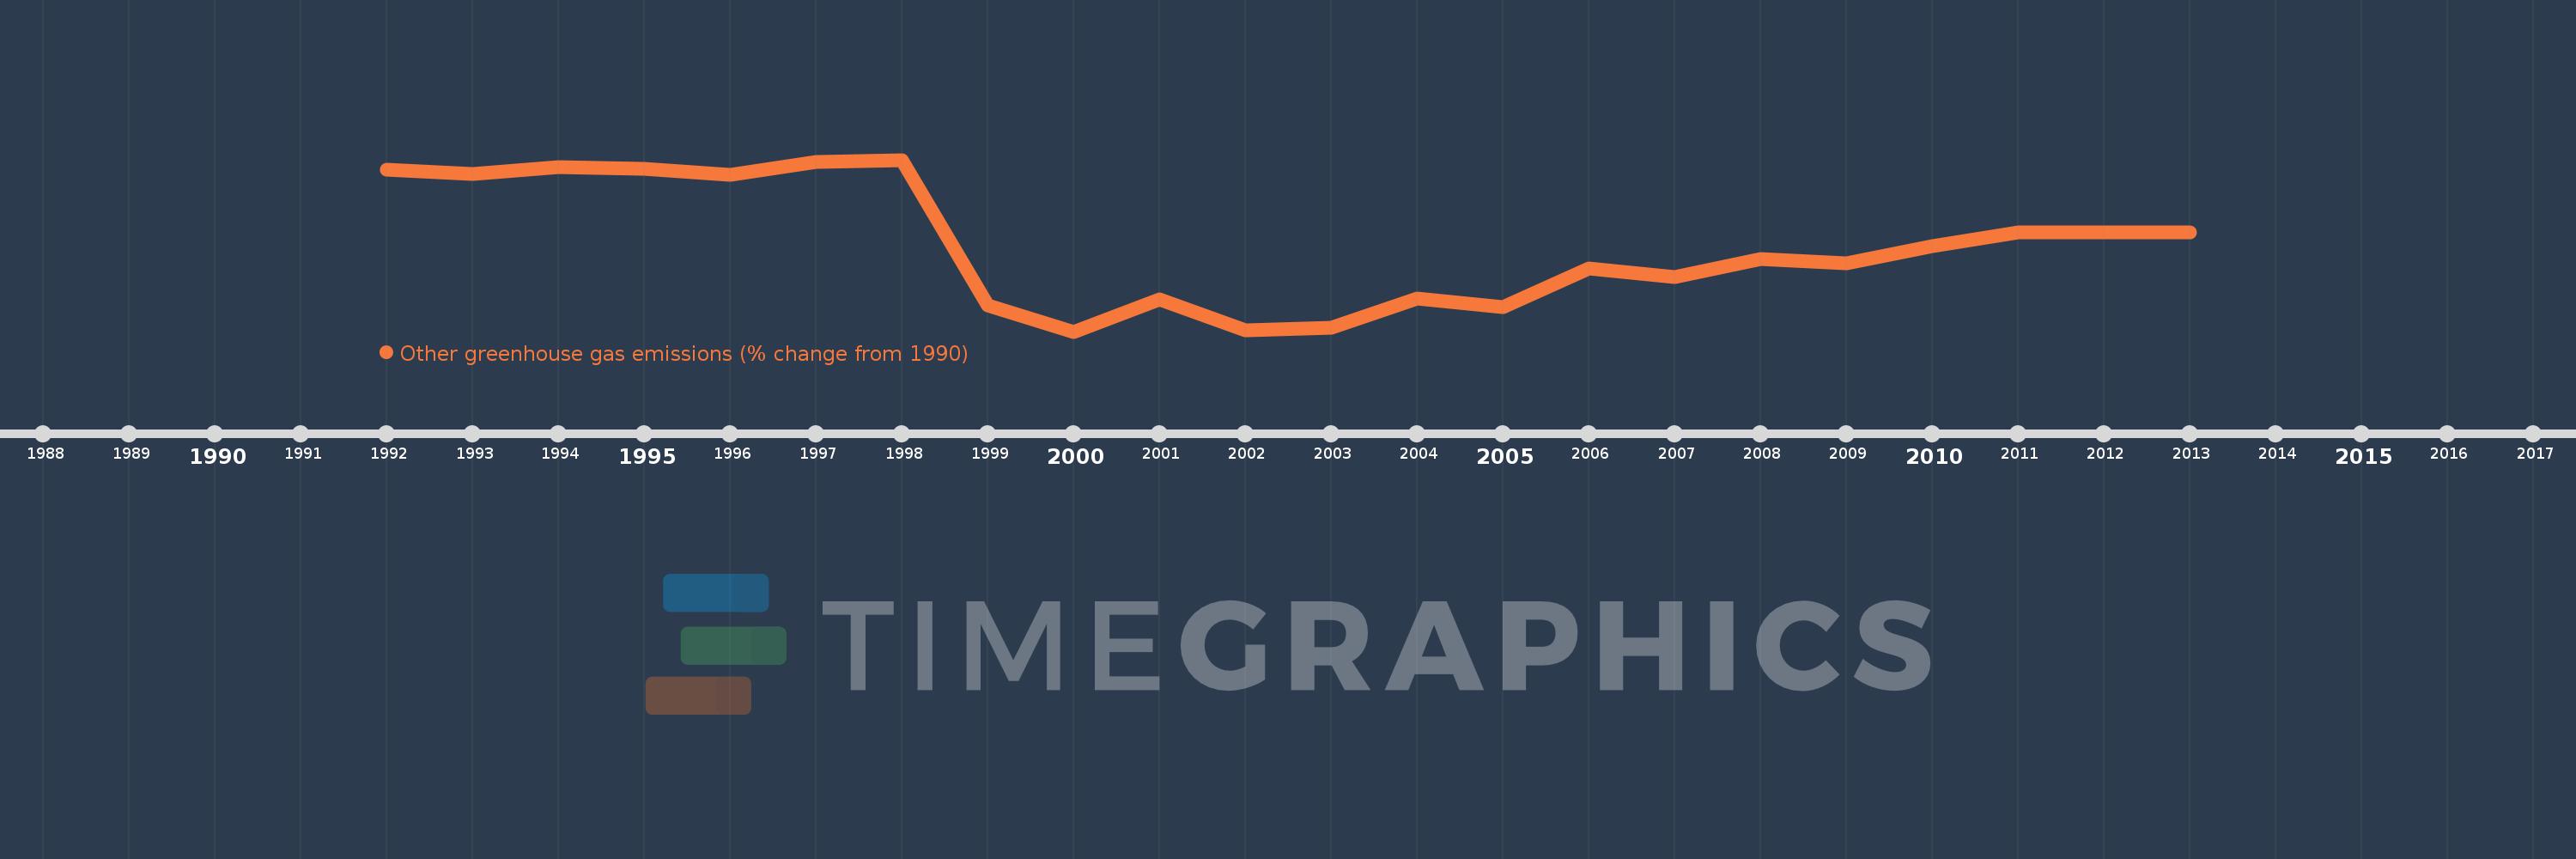
This timeline shows a graph from 1992 to 2013 of Euro area. No data until 1991. Number of actual observations by date: 22.
Source name:
World Development Indicators
Source organization:
World Bank staff estimates from original source: European Commission, Joint Research Centre (JRC)/Netherlands Environmental Assessment Agency (PBL). Emission Database for Global Atmospheric Research (EDGAR): http://edgar.jrc.ec.europa.eu/.
Categories, topics:
Climate Change, Environment
Last updated:
apr 23, 2017
Indicators value changes by year
Meaning:
-23.367
Minimum:
-50.271
jan 1, 2000
Maximum:
3.025
jan 1, 1998
At the date of observation
Value
Absolute change
Change from the previous value
jan 1, 1992
-0.081
-0.081
0.0%
jan 1, 1993
-1.278
-1.197
1.48K%
jan 1, 1994
0.721
+2.0
-156.43%
jan 1, 1995
0.166
-0.556
-77.03%
jan 1, 1996
-1.583
-1.749
-1.06K%
jan 1, 1997
2.353
+3.936
-248.62%
jan 1, 1998
3.025
+0.672
28.57%
jan 1, 1999
-42.24
-45.266
-1.5K%
jan 1, 2000
-50.271
-8.031
19.01%
jan 1, 2001
-40.255
+10.016
-19.92%
jan 1, 2002
-49.931
-9.676
24.04%
jan 1, 2003
-49.032
+0.898
-1.8%
jan 1, 2004
-39.939
+9.093
-18.55%
jan 1, 2005
-42.632
-2.693
6.74%
jan 1, 2006
-30.81
+11.822
-27.73%
jan 1, 2007
-33.25
-2.44
7.92%
jan 1, 2008
-27.708
+5.541
-16.67%
jan 1, 2009
-28.958
-1.25
4.51%
jan 1, 2010
-23.646
+5.313
-18.35%
jan 1, 2011
-19.572
+4.073
-17.23%
jan 1, 2012
-19.572
0.0
0.0%
jan 1, 2013
-19.572
0.0
0.0%
Ranking of countries by current statistics by years