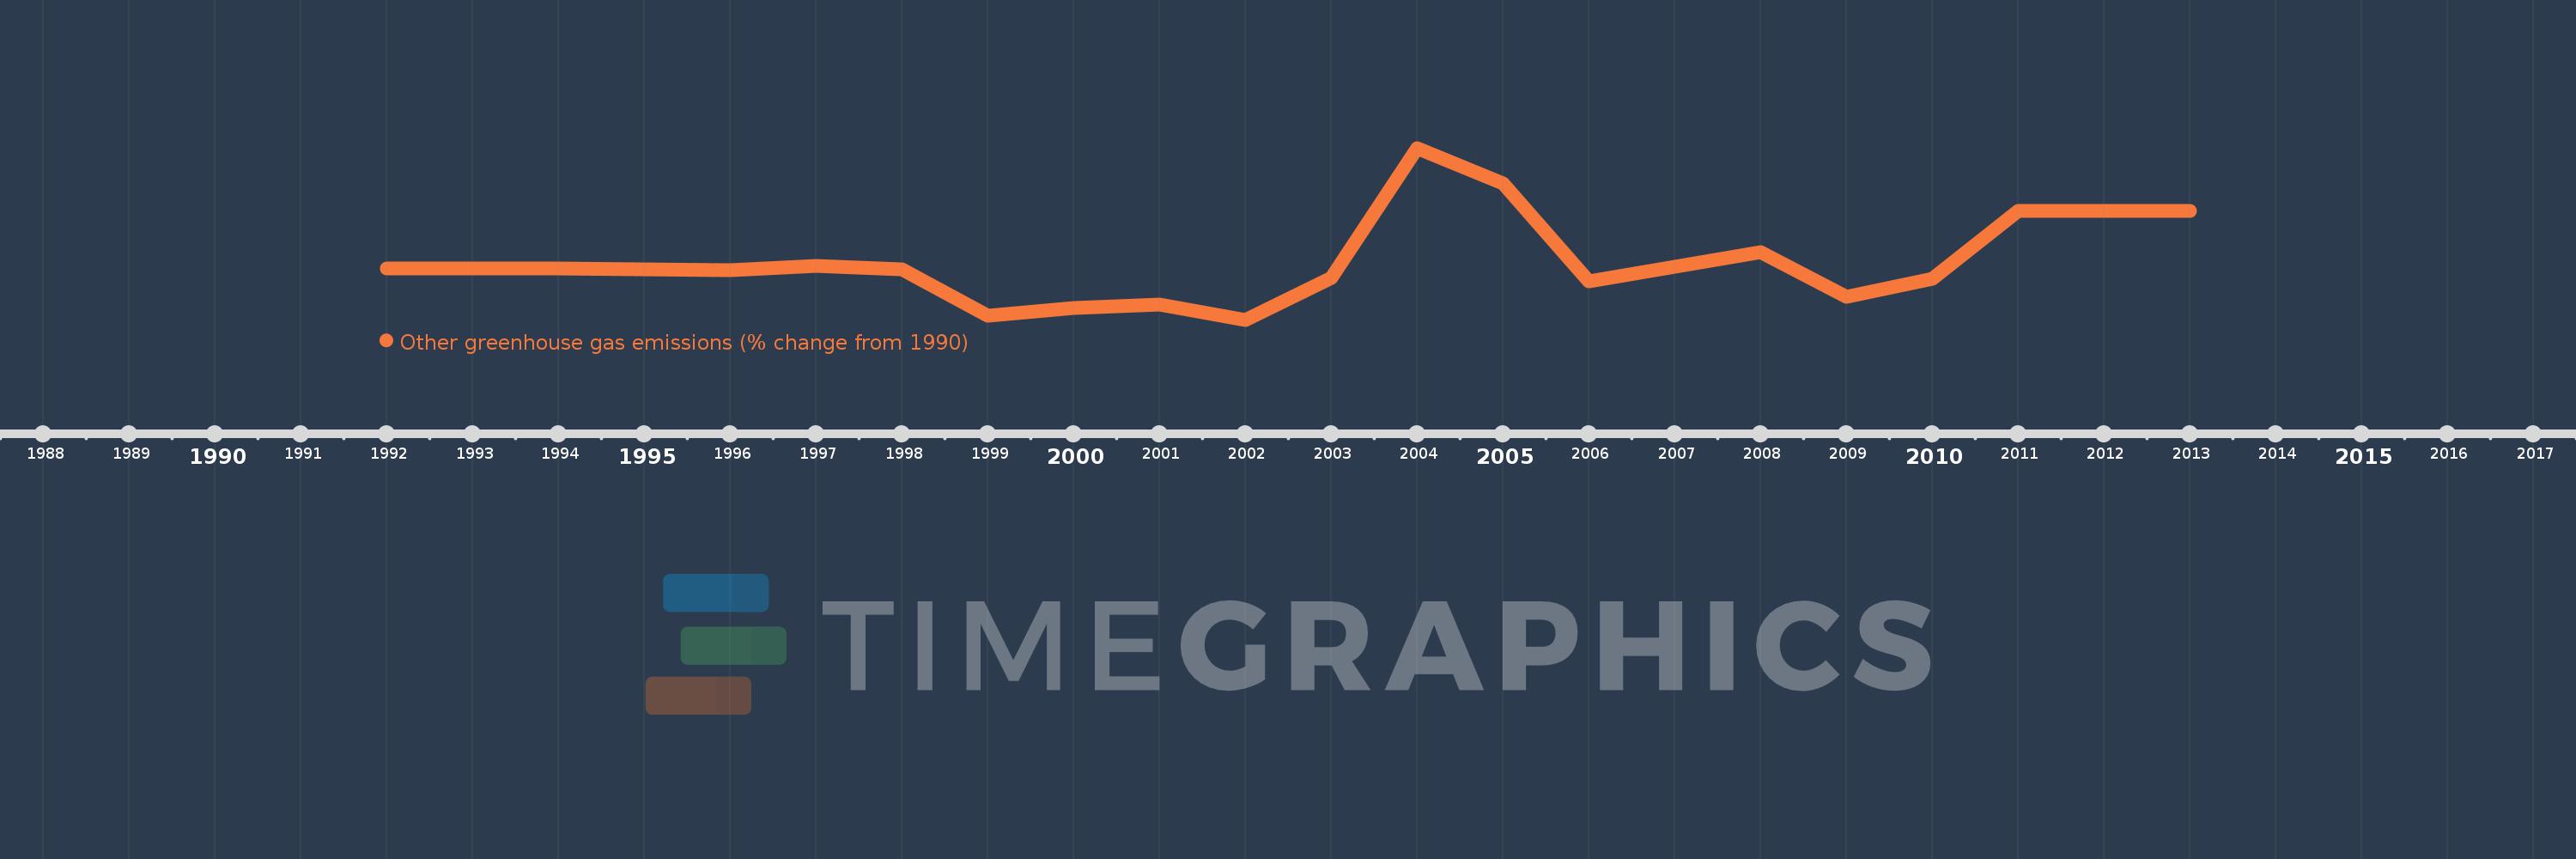
This timeline shows a graph from 1992 to 2013 of Turkmenistan. No data until 1991. Number of actual observations by date: 22.
Source name:
World Development Indicators
Source organization:
World Bank staff estimates from original source: European Commission, Joint Research Centre (JRC)/Netherlands Environmental Assessment Agency (PBL). Emission Database for Global Atmospheric Research (EDGAR): http://edgar.jrc.ec.europa.eu/.
Categories, topics:
Climate Change, Environment
Last updated:
apr 23, 2017
Indicators value changes by year
Meaning:
8.698
Minimum:
-84.513
jan 1, 2002
Maximum:
189.166
jan 1, 2004
At the date of observation
Value
Absolute change
Change from the previous value
jan 1, 1992
-2.919
-2.919
0.0%
jan 1, 1993
-3.41
-0.491
16.82%
jan 1, 1994
-3.197
+0.213
-6.23%
jan 1, 1995
-4.186
-0.989
30.94%
jan 1, 1996
-5.637
-1.451
34.65%
jan 1, 1997
1.871
+7.508
-133.19%
jan 1, 1998
-4.652
-6.523
-348.62%
jan 1, 1999
-77.487
-72.835
1.57K%
jan 1, 2000
-65.948
+11.539
-14.89%
jan 1, 2001
-60.685
+5.263
-7.98%
jan 1, 2002
-84.513
-23.828
39.26%
jan 1, 2003
-18.172
+66.341
-78.5%
jan 1, 2004
189.166
+207.338
-1.14K%
jan 1, 2005
132.302
-56.864
-30.06%
jan 1, 2006
-23.826
-156.128
-118.01%
jan 1, 2007
0.133
+23.959
-100.56%
jan 1, 2008
22.601
+22.468
16.89K%
jan 1, 2009
-47.431
-70.032
-309.86%
jan 1, 2010
-19.219
+28.212
-59.48%
jan 1, 2011
88.852
+108.071
-562.32%
jan 1, 2012
88.852
0.0
0.0%
jan 1, 2013
88.852
+0.0
0.0%
Ranking of countries by current statistics by years