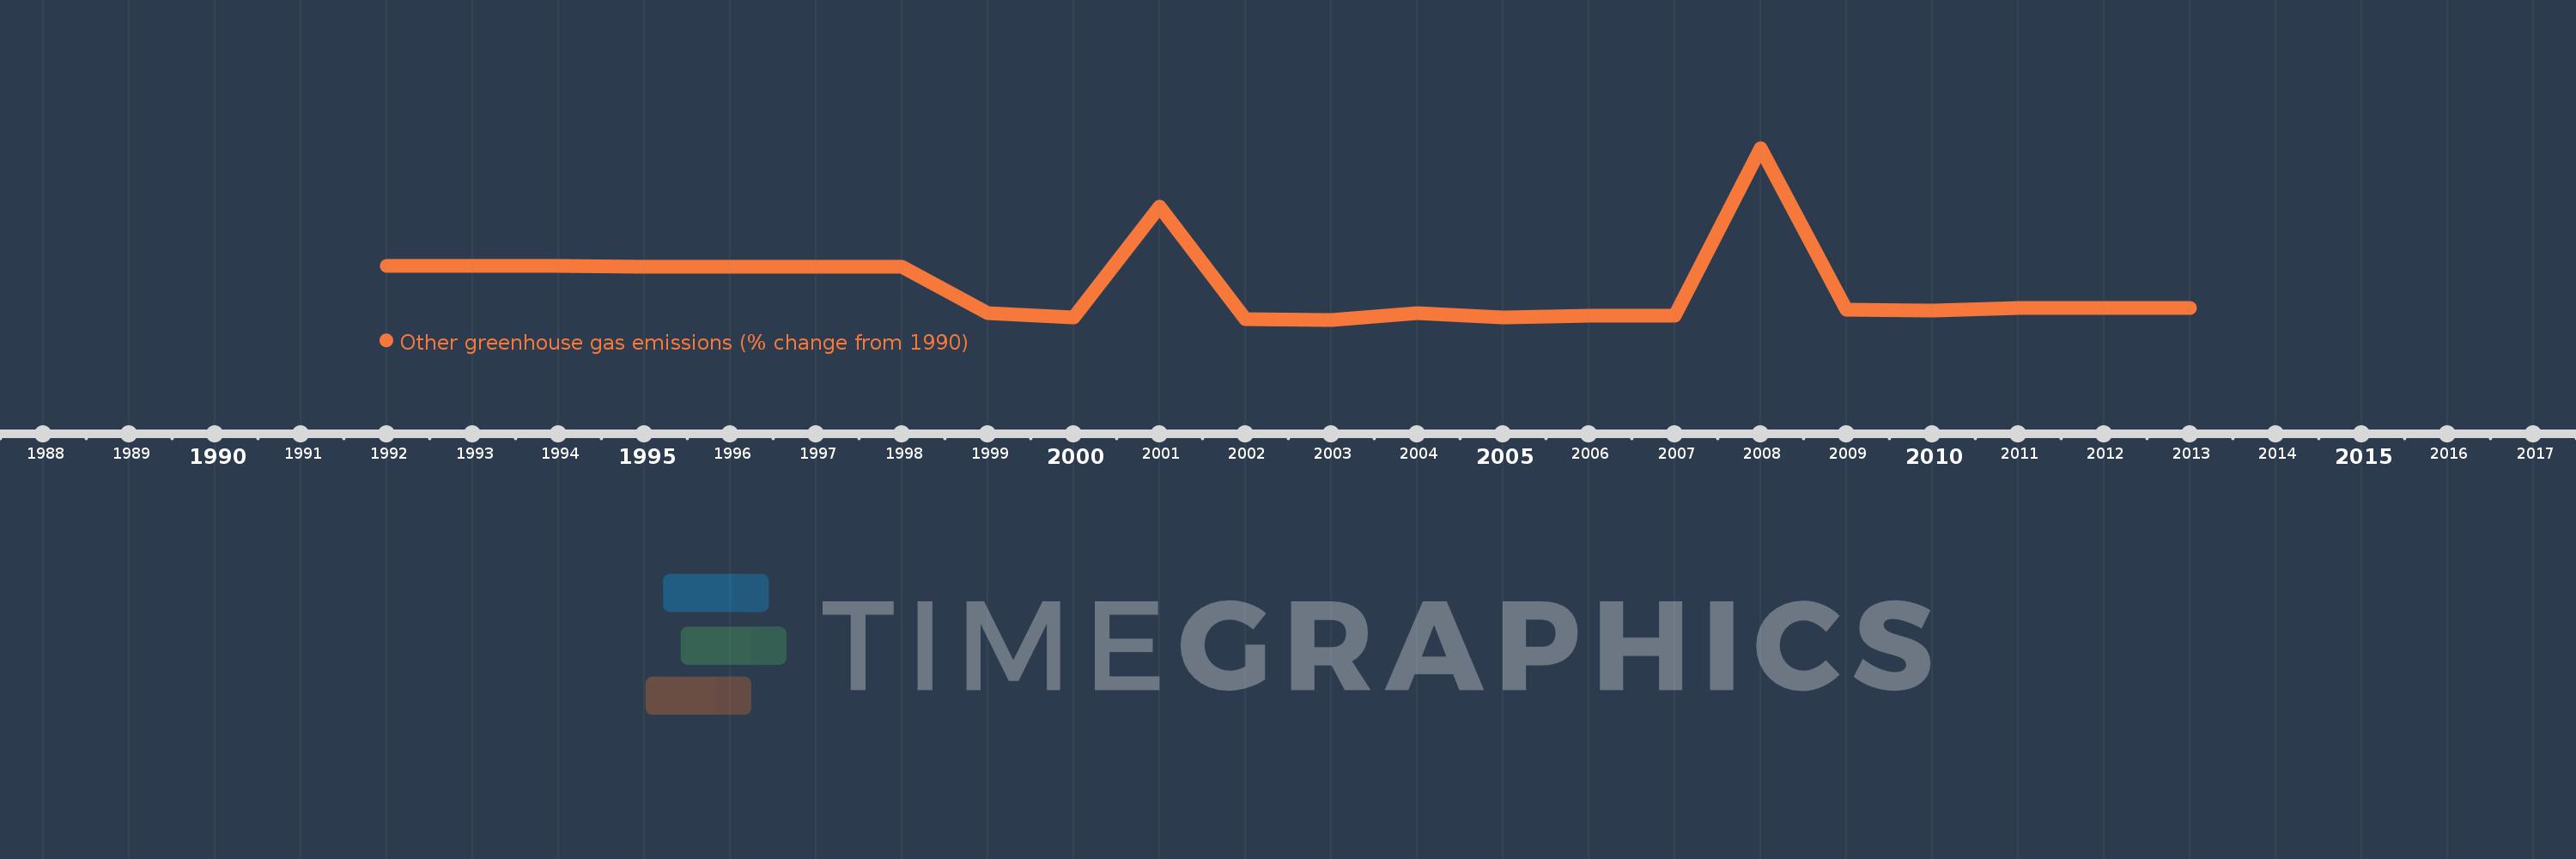
This timeline shows a graph from 1992 to 2013 of Albania. No data until 1991. Number of actual observations by date: 22.
Source name:
World Development Indicators
Source organization:
World Bank staff estimates from original source: European Commission, Joint Research Centre (JRC)/Netherlands Environmental Assessment Agency (PBL). Emission Database for Global Atmospheric Research (EDGAR): http://edgar.jrc.ec.europa.eu/.
Categories, topics:
Climate Change, Environment
Last updated:
apr 23, 2017
Indicators value changes by year
Meaning:
-36.162
Minimum:
-94.925
jan 1, 2003
Maximum:
205.735
jan 1, 2008
At the date of observation
Value
Absolute change
Change from the previous value
jan 1, 1992
-0.473
-0.473
0.0%
jan 1, 1993
-0.941
-0.468
99.07%
jan 1, 1994
-1.366
-0.425
45.14%
jan 1, 1995
-1.727
-0.361
26.44%
jan 1, 1996
-1.946
-0.219
12.67%
jan 1, 1997
-2.066
-0.12
6.17%
jan 1, 1998
-2.56
-0.494
23.9%
jan 1, 1999
-82.775
-80.215
3.13K%
jan 1, 2000
-91.457
-8.683
10.49%
jan 1, 2001
102.844
+194.302
-212.45%
jan 1, 2002
-93.649
-196.493
-191.06%
jan 1, 2003
-94.925
-1.276
1.36%
jan 1, 2004
-83.146
+11.779
-12.41%
jan 1, 2005
-90.682
-7.537
9.06%
jan 1, 2006
-87.79
+2.892
-3.19%
jan 1, 2007
-87.344
+0.447
-0.51%
jan 1, 2008
205.735
+293.079
-335.55%
jan 1, 2009
-76.93
-282.665
-137.39%
jan 1, 2010
-79.332
-2.402
3.12%
jan 1, 2011
-75.014
+4.318
-5.44%
jan 1, 2012
-75.014
0.0
0.0%
jan 1, 2013
-75.014
0.0
0.0%
Ranking of countries by current statistics by years