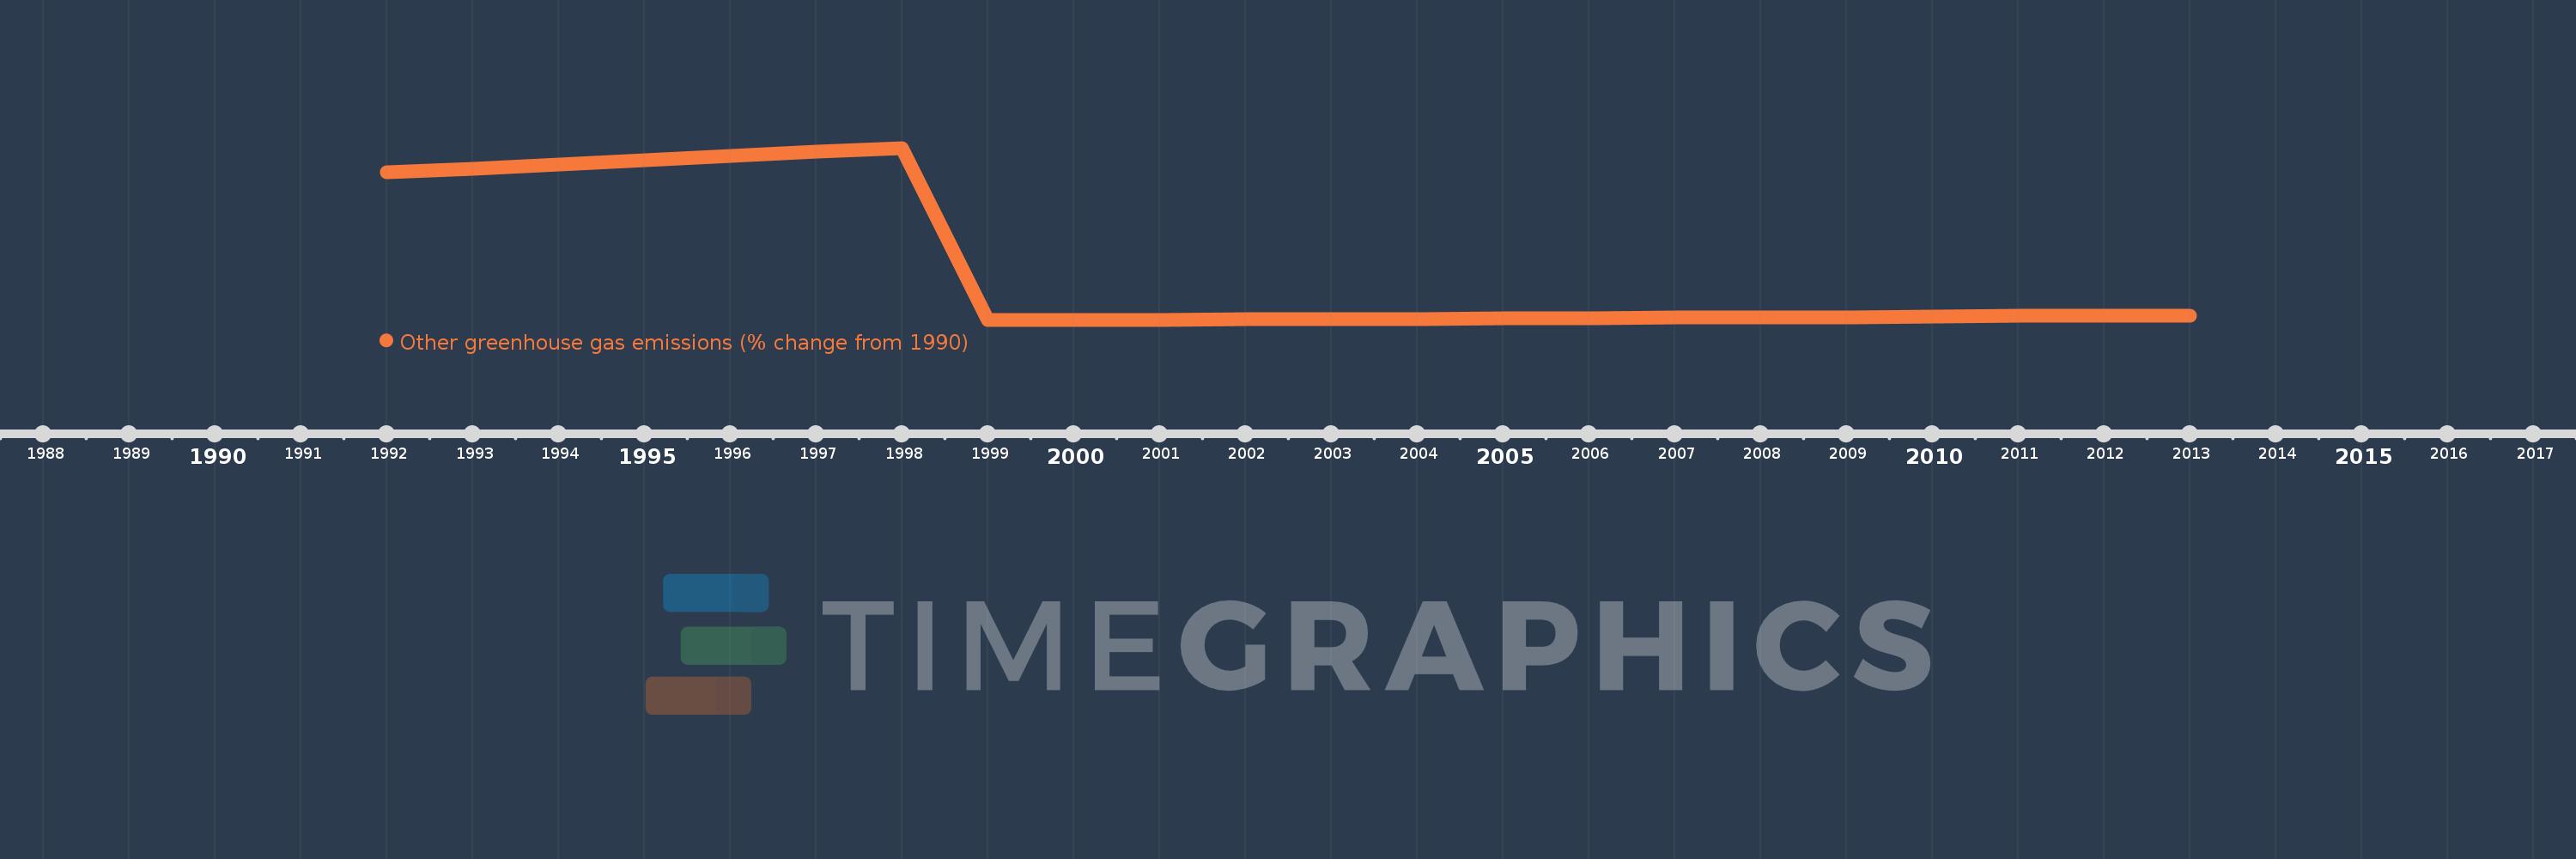
This timeline shows a graph from 1992 to 2013 of Oman. No data until 1991. Number of actual observations by date: 22.
Source name:
World Development Indicators
Source organization:
World Bank staff estimates from original source: European Commission, Joint Research Centre (JRC)/Netherlands Environmental Assessment Agency (PBL). Emission Database for Global Atmospheric Research (EDGAR): http://edgar.jrc.ec.europa.eu/.
Categories, topics:
Climate Change, Environment
Last updated:
apr 23, 2017
Indicators value changes by year
Meaning:
-63.642
Minimum:
-99.932
jan 1, 2001
Maximum:
20.157
jan 1, 1998
At the date of observation
Value
Absolute change
Change from the previous value
jan 1, 1992
2.87
+2.87
0.0%
jan 1, 1993
5.74
+2.871
100.03%
jan 1, 1994
8.617
+2.876
50.1%
jan 1, 1995
11.498
+2.881
33.44%
jan 1, 1996
14.391
+2.894
25.17%
jan 1, 1997
17.278
+2.887
20.06%
jan 1, 1998
20.157
+2.879
16.66%
jan 1, 1999
-99.916
-120.073
-595.68%
jan 1, 2000
-99.906
+0.009
-0.01%
jan 1, 2001
-99.932
-0.025
0.03%
jan 1, 2002
-99.761
+0.17
-0.17%
jan 1, 2003
-99.579
+0.182
-0.18%
jan 1, 2004
-99.348
+0.231
-0.23%
jan 1, 2005
-99.049
+0.299
-0.3%
jan 1, 2006
-98.748
+0.3
-0.3%
jan 1, 2007
-98.498
+0.25
-0.25%
jan 1, 2008
-98.24
+0.258
-0.26%
jan 1, 2009
-98.027
+0.213
-0.22%
jan 1, 2010
-97.629
+0.397
-0.41%
jan 1, 2011
-97.348
+0.281
-0.29%
jan 1, 2012
-97.348
+0.0
0.0%
jan 1, 2013
-97.348
0.0
0.0%
Ranking of countries by current statistics by years