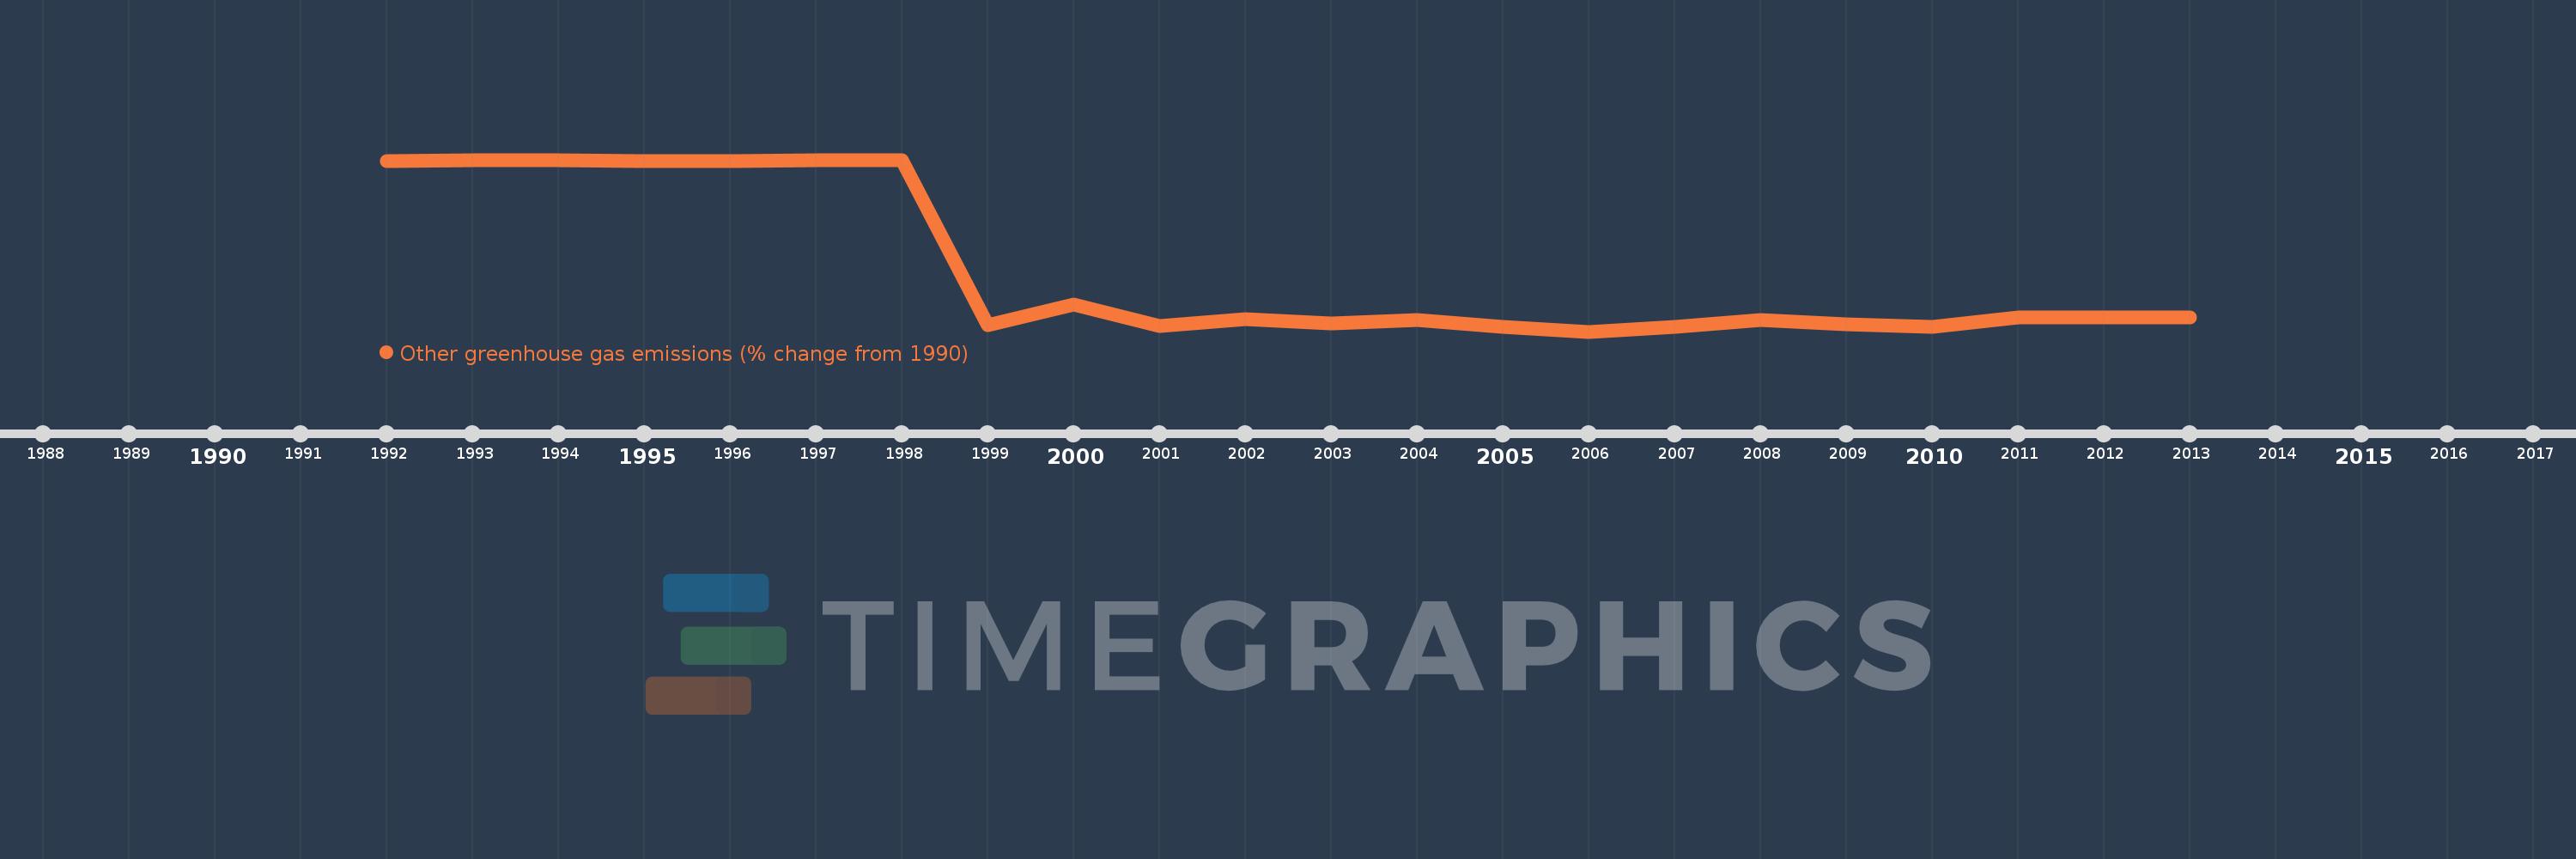
This timeline shows a graph from 1992 to 2013 of Iraq. No data until 1991. Number of actual observations by date: 22.
Source name:
World Development Indicators
Source organization:
World Bank staff estimates from original source: European Commission, Joint Research Centre (JRC)/Netherlands Environmental Assessment Agency (PBL). Emission Database for Global Atmospheric Research (EDGAR): http://edgar.jrc.ec.europa.eu/.
Categories, topics:
Climate Change, Environment
Last updated:
apr 23, 2017
Indicators value changes by year
Meaning:
-59.725
Minimum:
-93.416
jan 1, 2006
Maximum:
1.332
jan 1, 1993
At the date of observation
Value
Absolute change
Change from the previous value
jan 1, 1992
0.82
+0.82
0.0%
jan 1, 1993
1.332
+0.512
62.41%
jan 1, 1994
1.076
-0.256
-19.2%
jan 1, 1995
0.85
-0.226
-20.99%
jan 1, 1996
0.595
-0.256
-30.08%
jan 1, 1997
1.014
+0.42
70.58%
jan 1, 1998
1.097
+0.082
8.12%
jan 1, 1999
-89.763
-90.86
-8.29K%
jan 1, 2000
-78.575
+11.188
-12.46%
jan 1, 2001
-90.163
-11.588
14.75%
jan 1, 2002
-86.539
+3.624
-4.02%
jan 1, 2003
-88.818
-2.279
2.63%
jan 1, 2004
-86.892
+1.925
-2.17%
jan 1, 2005
-90.869
-3.976
4.58%
jan 1, 2006
-93.416
-2.548
2.8%
jan 1, 2007
-91.001
+2.415
-2.59%
jan 1, 2008
-87.028
+3.974
-4.37%
jan 1, 2009
-89.293
-2.265
2.6%
jan 1, 2010
-90.913
-1.62
1.81%
jan 1, 2011
-85.823
+5.09
-5.6%
jan 1, 2012
-85.823
0.0
0.0%
jan 1, 2013
-85.823
+0.0
0.0%
Ranking of countries by current statistics by years