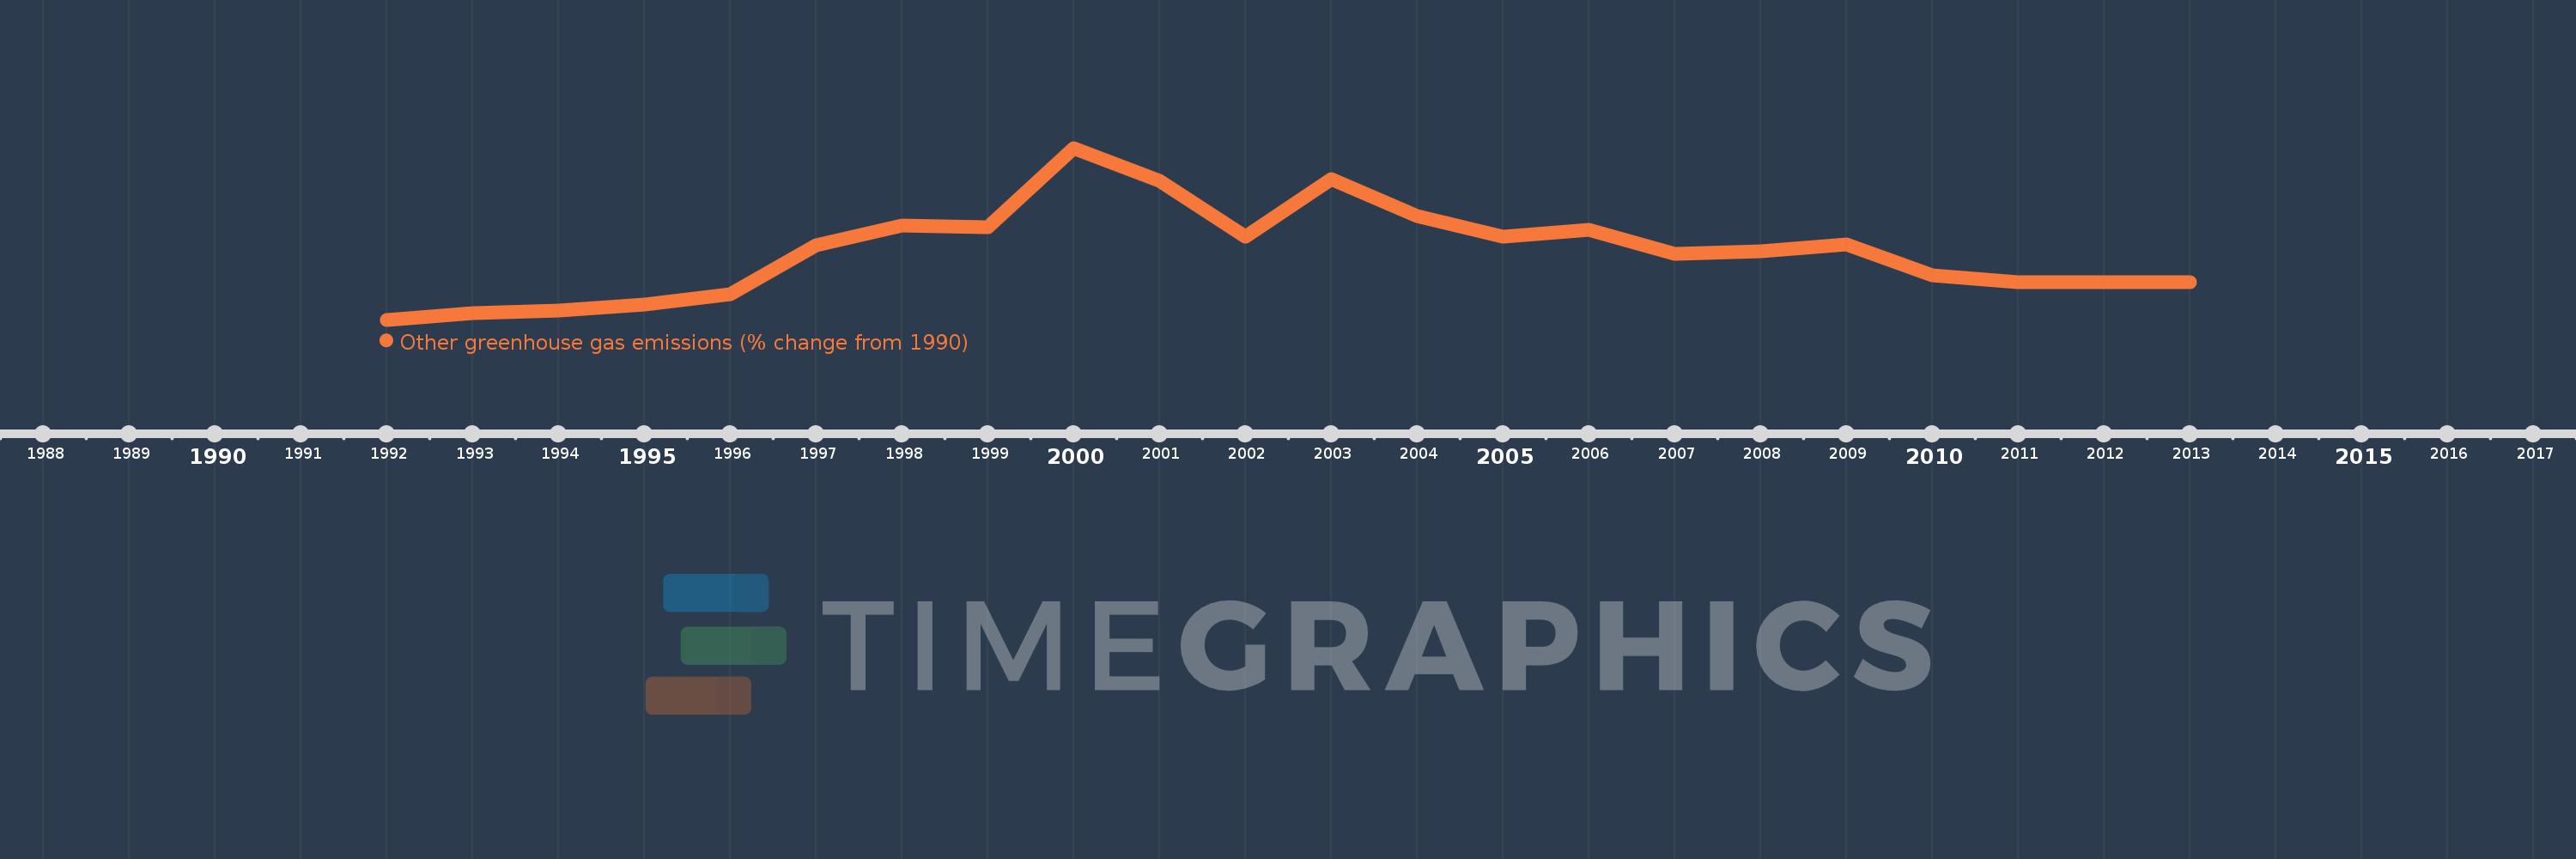
This timeline shows a graph from 1992 to 2013 of Korea, Rep.. No data until 1991. Number of actual observations by date: 22.
Source name:
World Development Indicators
Source organization:
World Bank staff estimates from original source: European Commission, Joint Research Centre (JRC)/Netherlands Environmental Assessment Agency (PBL). Emission Database for Global Atmospheric Research (EDGAR): http://edgar.jrc.ec.europa.eu/.
Categories, topics:
Climate Change, Environment
Last updated:
apr 23, 2017
Indicators value changes by year
Meaning:
74.43
Minimum:
9.473
jan 1, 1992
Maximum:
173.709
jan 1, 2000
At the date of observation
Value
Absolute change
Change from the previous value
jan 1, 1992
9.473
+9.473
0.0%
jan 1, 1993
15.556
+6.083
64.21%
jan 1, 1994
18.345
+2.79
17.94%
jan 1, 1995
23.958
+5.612
30.59%
jan 1, 1996
34.015
+10.057
41.98%
jan 1, 1997
80.892
+46.878
137.82%
jan 1, 1998
99.87
+18.978
23.46%
jan 1, 1999
97.759
-2.111
-2.11%
jan 1, 2000
173.709
+75.95
77.69%
jan 1, 2001
142.235
-31.474
-18.12%
jan 1, 2002
88.523
-53.712
-37.76%
jan 1, 2003
143.582
+55.059
62.2%
jan 1, 2004
108.567
-35.015
-24.39%
jan 1, 2005
88.69
-19.877
-18.31%
jan 1, 2006
95.26
+6.569
7.41%
jan 1, 2007
72.423
-22.837
-23.97%
jan 1, 2008
74.837
+2.413
3.33%
jan 1, 2009
81.424
+6.588
8.8%
jan 1, 2010
51.952
-29.472
-36.2%
jan 1, 2011
45.461
-6.491
-12.49%
jan 1, 2012
45.461
+0.0
0.0%
jan 1, 2013
45.461
0.0
0.0%
Ranking of countries by current statistics by years