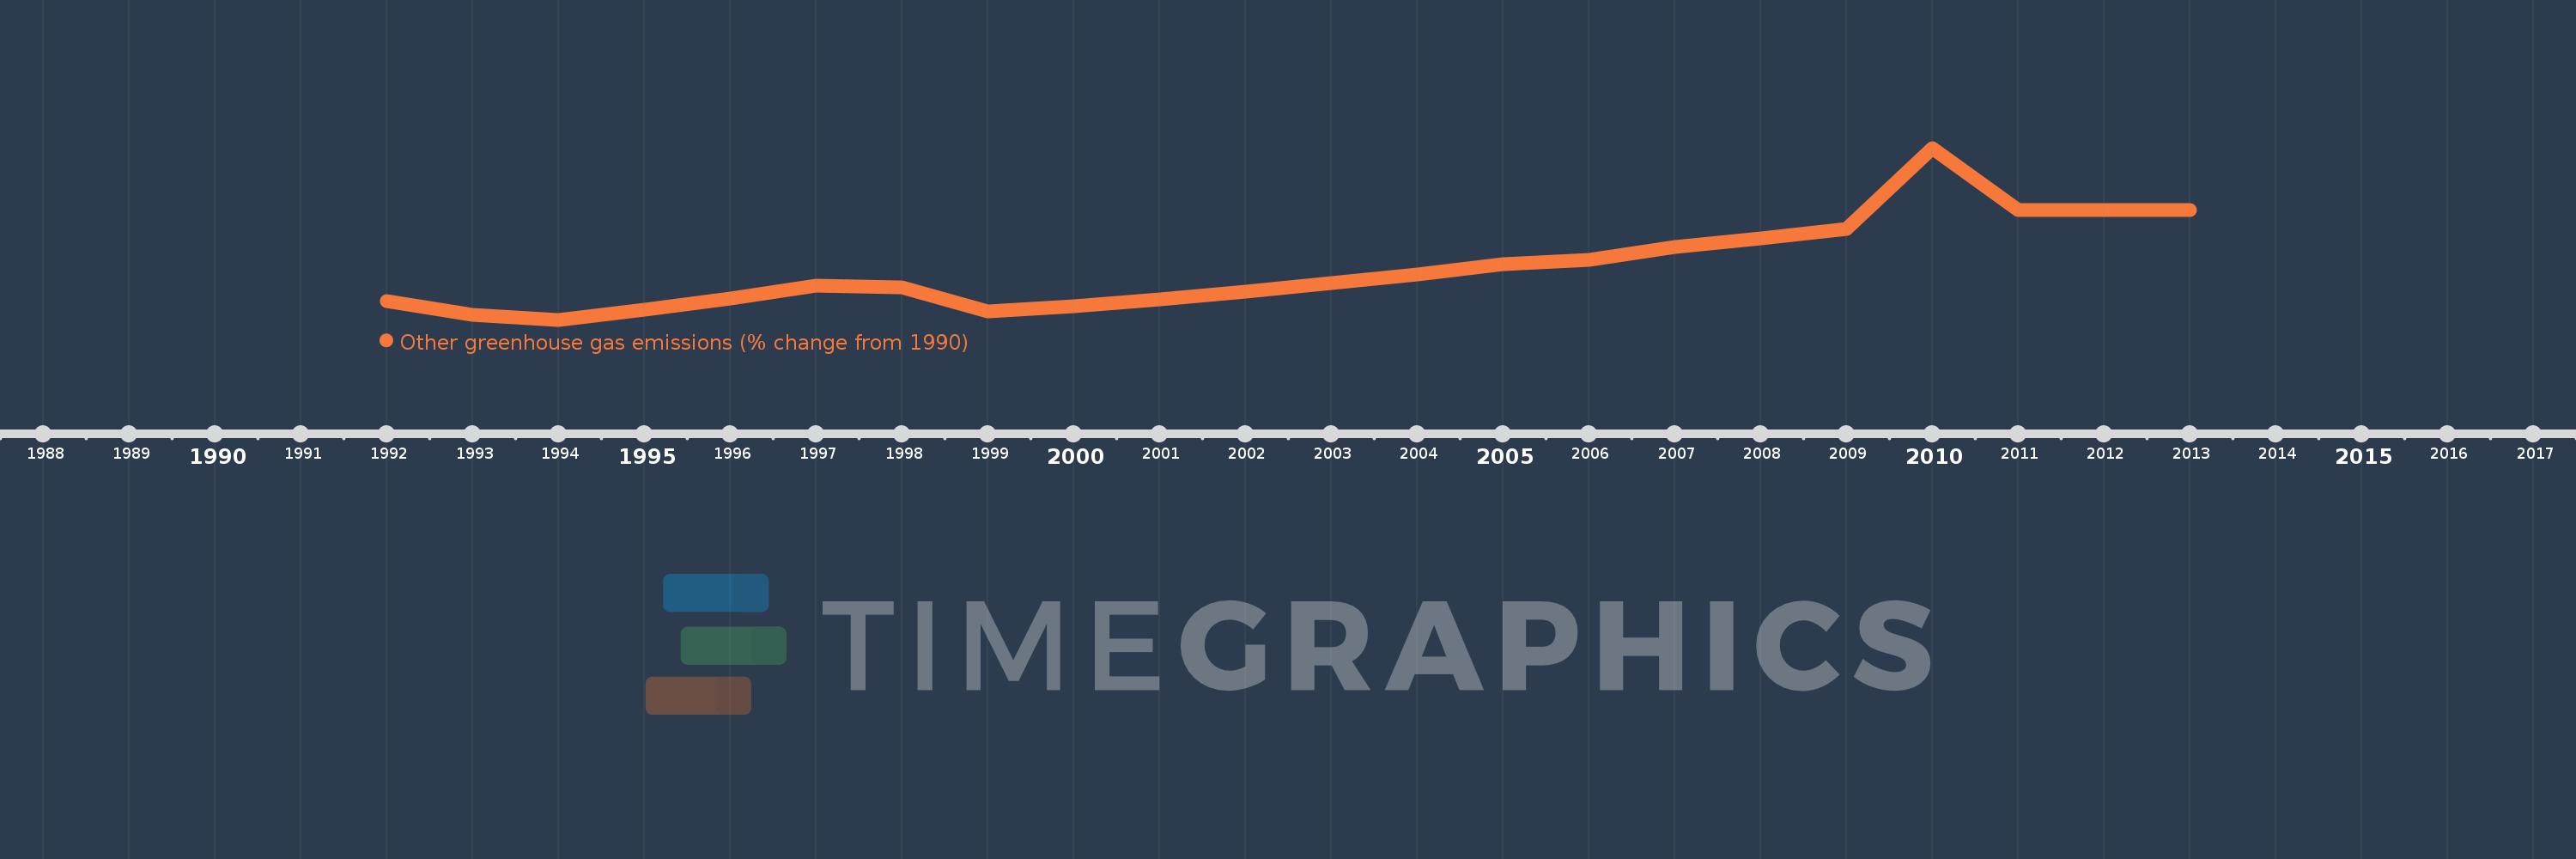
This timeline shows a graph from 1992 to 2013 of Austria. No data until 1991. Number of actual observations by date: 22.
Source name:
World Development Indicators
Source organization:
World Bank staff estimates from original source: European Commission, Joint Research Centre (JRC)/Netherlands Environmental Assessment Agency (PBL). Emission Database for Global Atmospheric Research (EDGAR): http://edgar.jrc.ec.europa.eu/.
Categories, topics:
Climate Change, Environment
Last updated:
apr 23, 2017
Indicators value changes by year
Meaning:
19.687
Minimum:
-41.393
jan 1, 1994
Maximum:
162.43
jan 1, 2010
At the date of observation
Value
Absolute change
Change from the previous value
jan 1, 1992
-19.607
-19.607
0.0%
jan 1, 1993
-35.396
-15.789
80.53%
jan 1, 1994
-41.393
-5.997
16.94%
jan 1, 1995
-29.272
+12.121
-29.28%
jan 1, 1996
-16.264
+13.008
-44.44%
jan 1, 1997
-1.095
+15.169
-93.27%
jan 1, 1998
-3.413
-2.318
211.64%
jan 1, 1999
-31.978
-28.565
837.01%
jan 1, 2000
-24.897
+7.08
-22.14%
jan 1, 2001
-17.666
+7.231
-29.04%
jan 1, 2002
-8.22
+9.446
-53.47%
jan 1, 2003
1.974
+10.194
-124.01%
jan 1, 2004
12.337
+10.363
525.0%
jan 1, 2005
24.228
+11.891
96.39%
jan 1, 2006
29.295
+5.067
20.92%
jan 1, 2007
45.2
+15.905
54.29%
jan 1, 2008
55.513
+10.313
22.82%
jan 1, 2009
66.596
+11.082
19.96%
jan 1, 2010
162.43
+95.834
143.9%
jan 1, 2011
88.25
-74.18
-45.67%
jan 1, 2012
88.25
+0.0
0.0%
jan 1, 2013
88.25
0.0
0.0%
Ranking of countries by current statistics by years