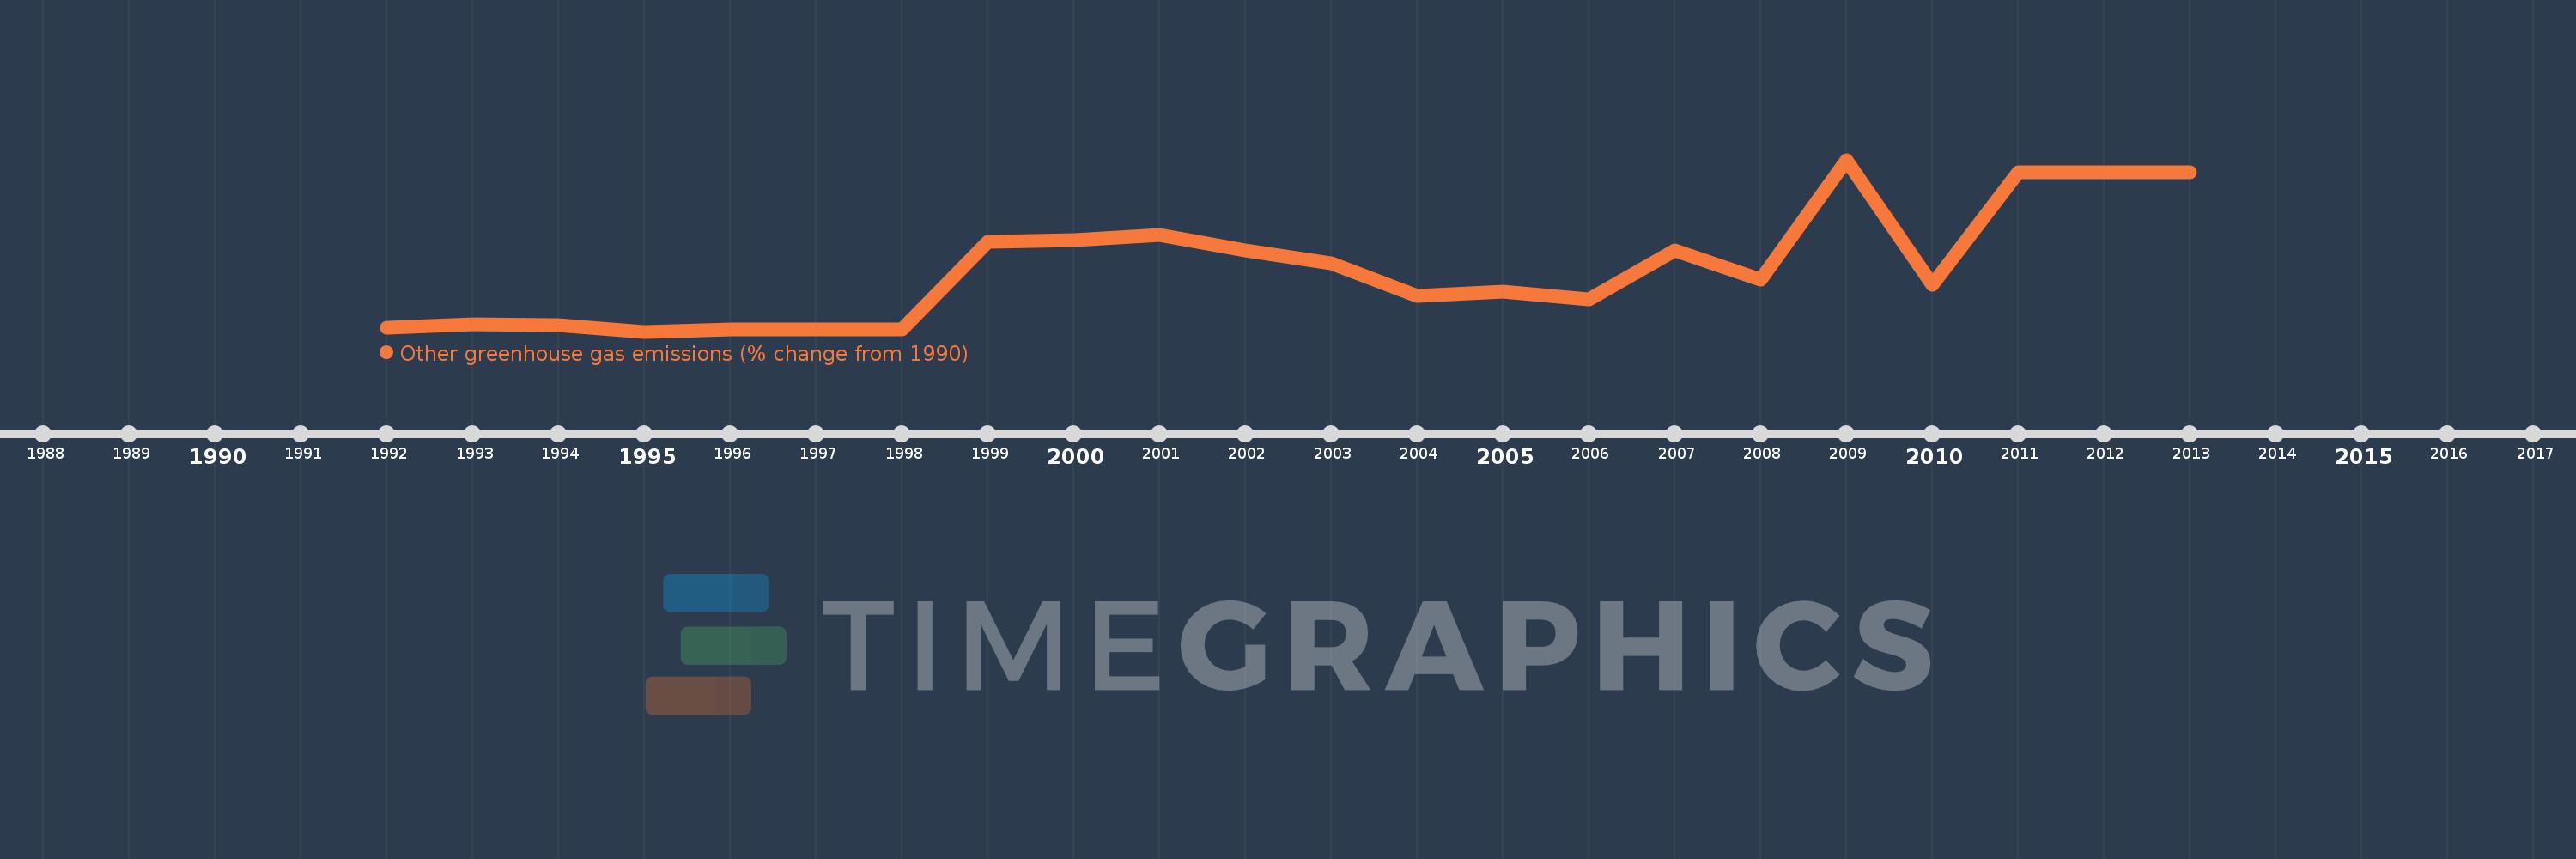
This timeline shows a graph from 1992 to 2013 of Small states. No data until 1991. Number of actual observations by date: 22.
Source name:
World Development Indicators
Source organization:
World Bank staff estimates from original source: European Commission, Joint Research Centre (JRC)/Netherlands Environmental Assessment Agency (PBL). Emission Database for Global Atmospheric Research (EDGAR): http://edgar.jrc.ec.europa.eu/.
Categories, topics:
Climate Change, Environment
Last updated:
apr 23, 2017
Indicators value changes by year
Meaning:
153.142
Minimum:
-15.426
jan 1, 1995
Maximum:
442.692
jan 1, 2009
At the date of observation
Value
Absolute change
Change from the previous value
jan 1, 1992
-5.881
-5.881
0.0%
jan 1, 1993
5.172
+11.053
-187.95%
jan 1, 1994
2.558
-2.615
-50.55%
jan 1, 1995
-15.426
-17.984
-703.12%
jan 1, 1996
-10.448
+4.978
-32.27%
jan 1, 1997
-10.461
-0.013
0.12%
jan 1, 1998
-10.502
-0.041
0.39%
jan 1, 1999
225.054
+235.555
-2.24K%
jan 1, 2000
229.247
+4.193
1.86%
jan 1, 2001
242.325
+13.077
5.7%
jan 1, 2002
201.332
-40.993
-16.92%
jan 1, 2003
166.12
-35.212
-17.49%
jan 1, 2004
80.622
-85.498
-51.47%
jan 1, 2005
91.428
+10.806
13.4%
jan 1, 2006
70.767
-20.661
-22.6%
jan 1, 2007
201.37
+130.602
184.55%
jan 1, 2008
122.507
-78.863
-39.16%
jan 1, 2009
442.692
+320.185
261.36%
jan 1, 2010
109.298
-333.393
-75.31%
jan 1, 2011
410.453
+301.155
275.53%
jan 1, 2012
410.453
0.0
0.0%
jan 1, 2013
410.453
0.0
0.0%
Ranking of countries by current statistics by years