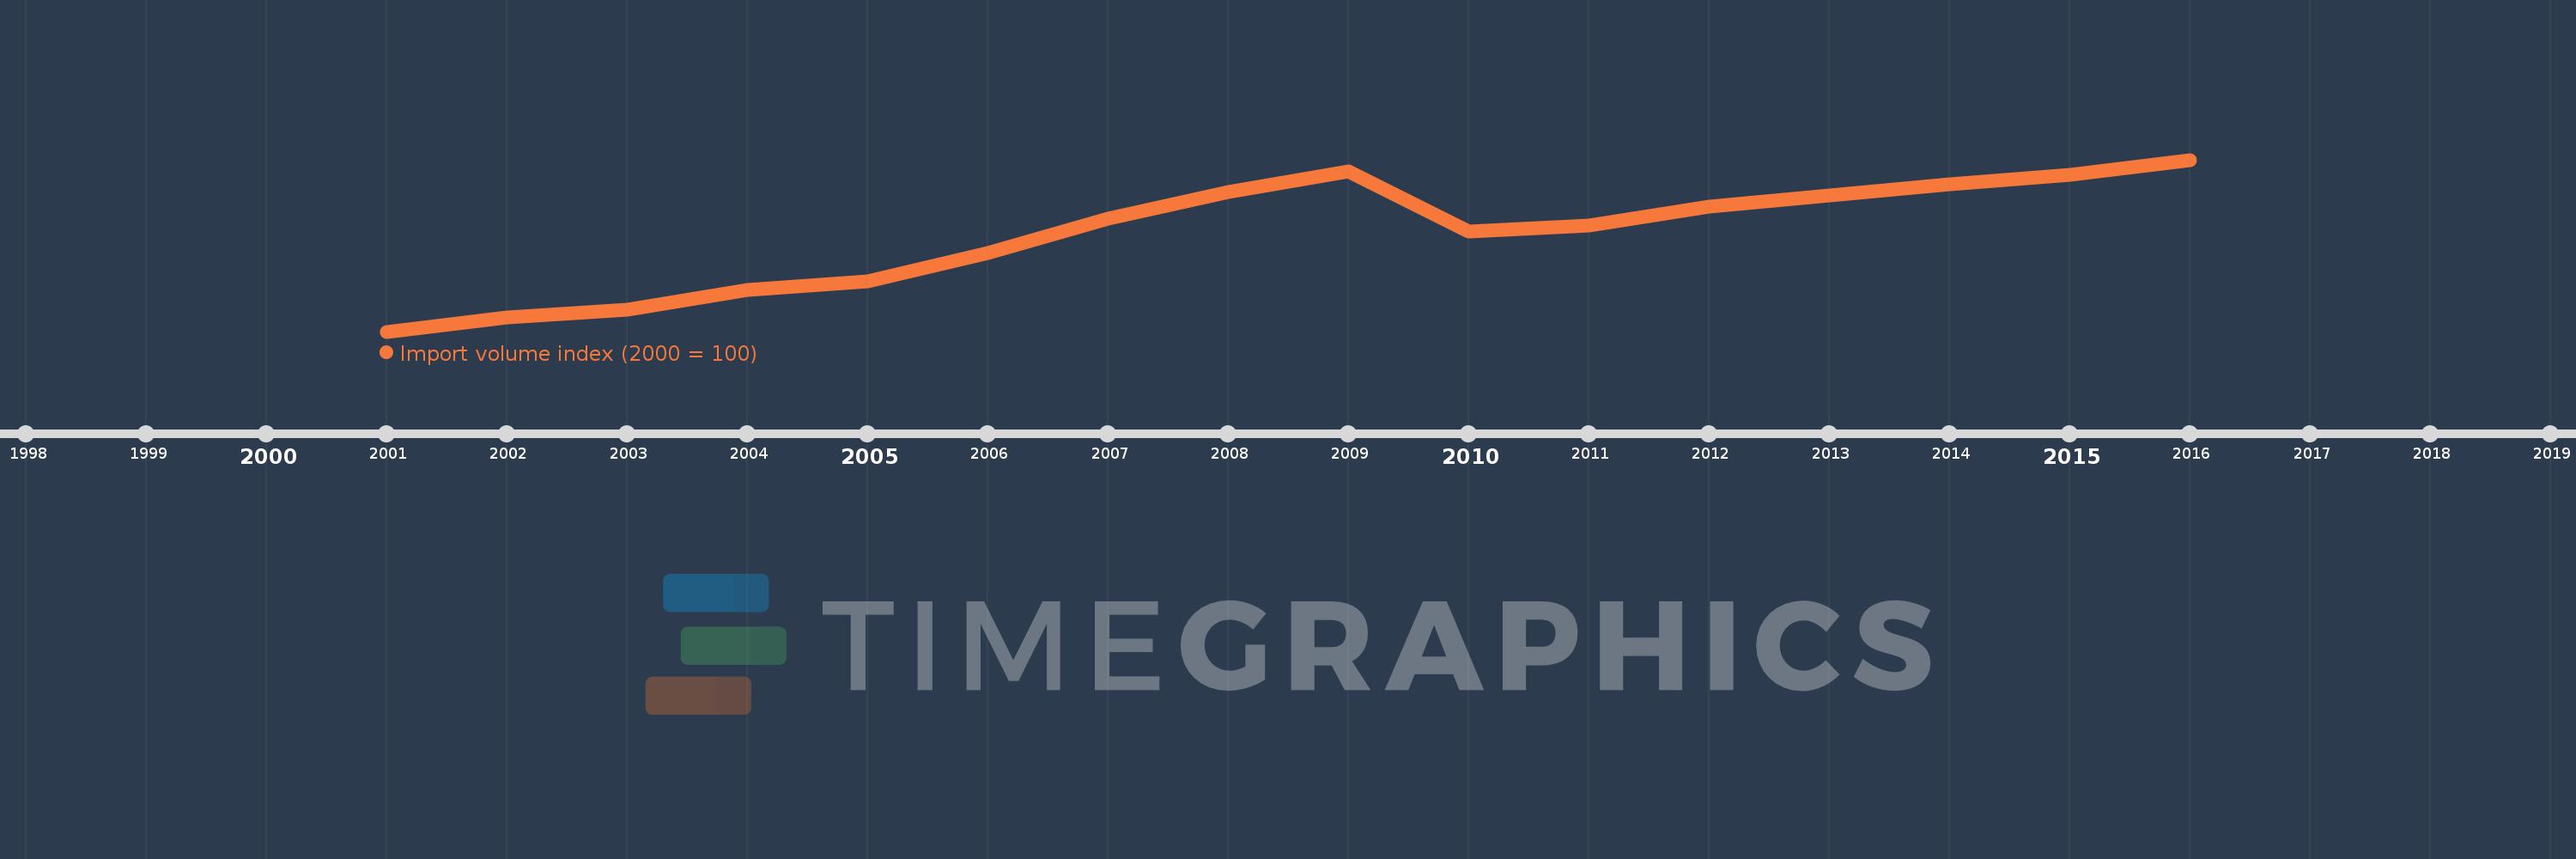
This timeline shows a graph from 2001 to 2016 of Bulgaria. No data until 2000. Number of actual observations by date: 16.
Source name:
World Development Indicators
Source organization:
United Nations Conference on Trade and Development, Handbook of Statistics and data files, and International Monetary Fund, International Financial Statistics.
Categories, topics:
Private Sector, Trade
Last updated:
apr 23, 2017
Indicators value changes by year
Meaning:
200.76
Minimum:
100.0
jan 1, 2001
Maximum:
277.333
jan 1, 2016
At the date of observation
Value
Absolute change
Change from the previous value
jan 1, 2001
100.0
+100.0
0.0%
jan 1, 2002
114.533
+14.533
14.53%
jan 1, 2003
122.812
+8.279
7.23%
jan 1, 2004
143.435
+20.623
16.79%
jan 1, 2005
152.242
+8.807
6.14%
jan 1, 2006
181.403
+29.161
19.15%
jan 1, 2007
216.282
+34.88
19.23%
jan 1, 2008
243.727
+27.445
12.69%
jan 1, 2009
265.55
+21.823
8.95%
jan 1, 2010
203.019
-62.531
-23.55%
jan 1, 2011
209.115
+6.096
3.0%
jan 1, 2012
228.803
+19.688
9.42%
jan 1, 2013
240.733
+11.93
5.21%
jan 1, 2014
251.755
+11.022
4.58%
jan 1, 2015
261.421
+9.666
3.84%
jan 1, 2016
277.333
+15.913
6.09%
Ranking of countries by current statistics by years