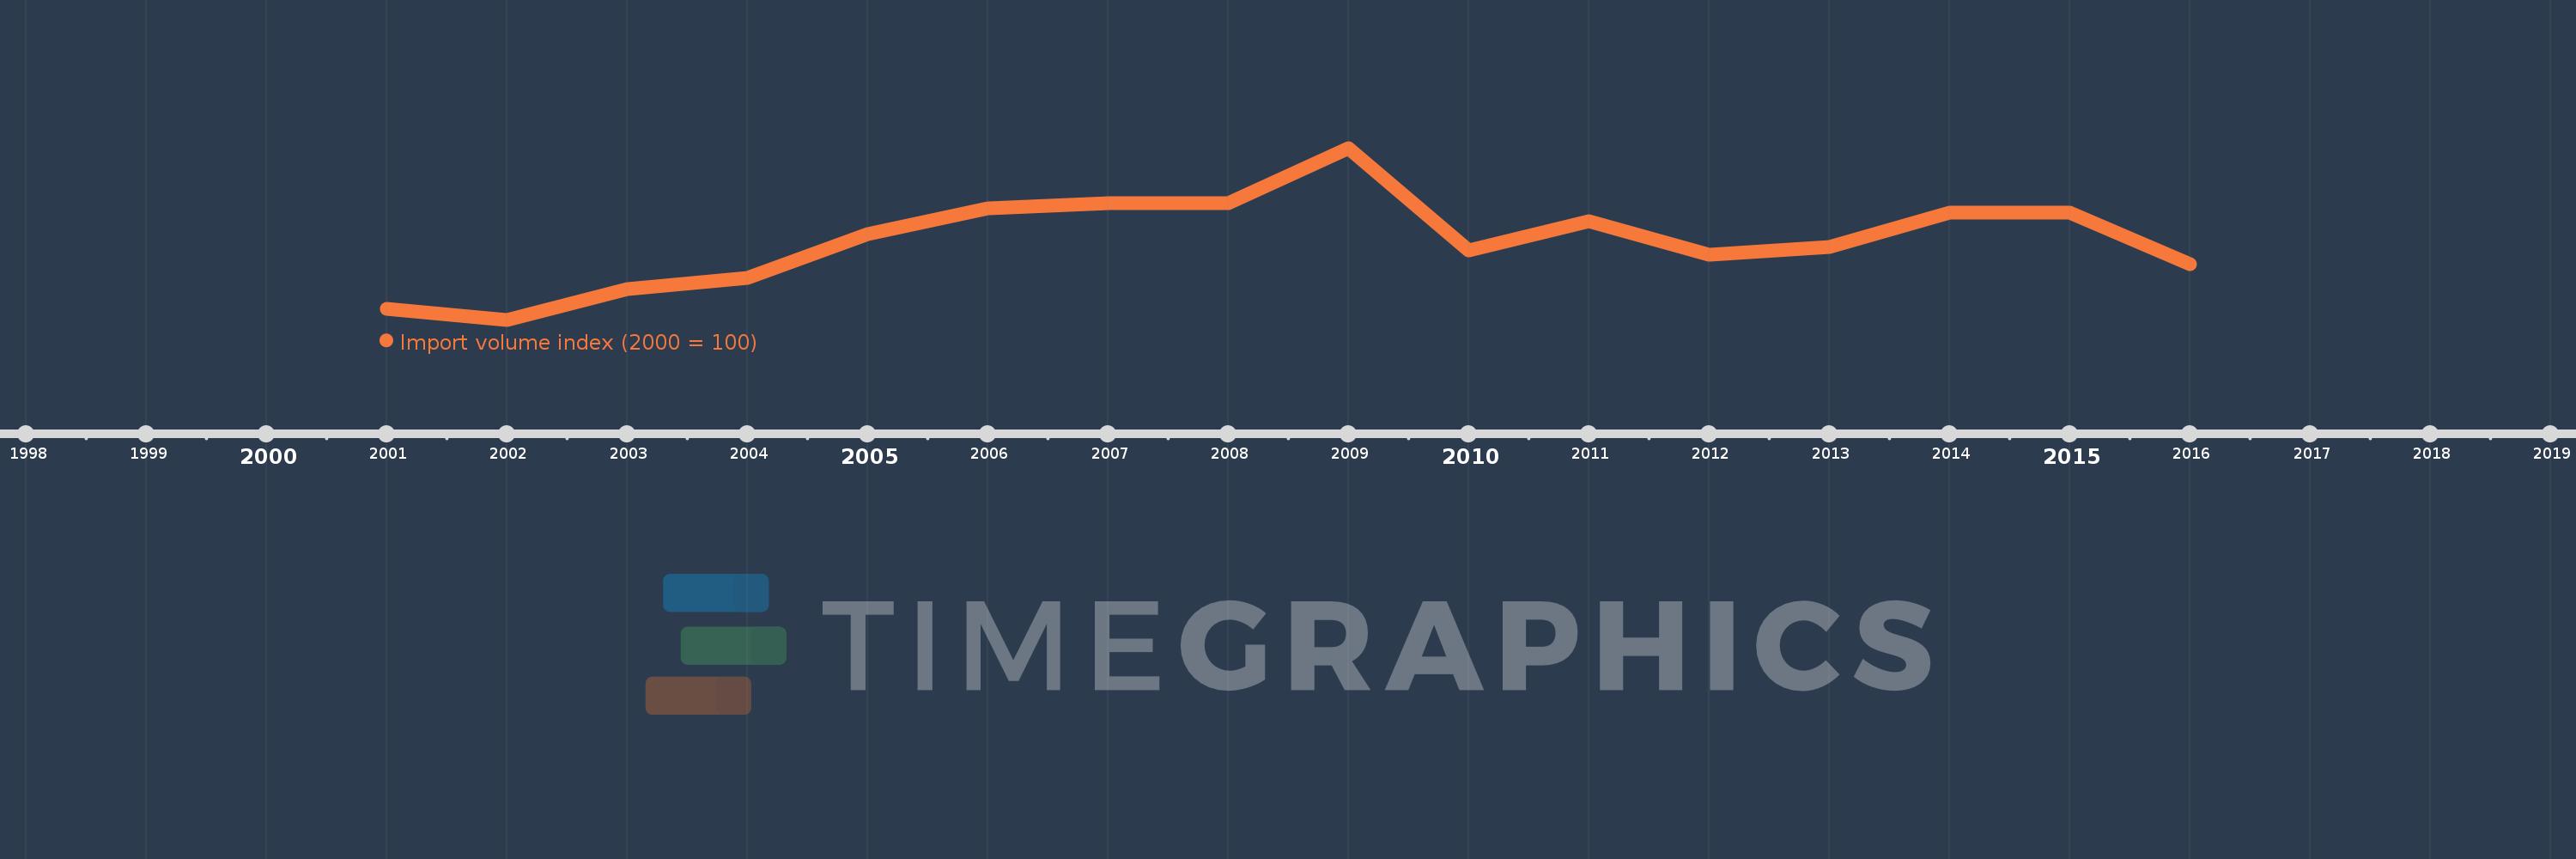
This timeline shows a graph from 2001 to 2016 of Bahrain. No data until 2000. Number of actual observations by date: 16.
Source name:
World Development Indicators
Source organization:
United Nations Conference on Trade and Development, Handbook of Statistics and data files, and International Monetary Fund, International Financial Statistics.
Categories, topics:
Private Sector, Trade
Last updated:
apr 23, 2017
Indicators value changes by year
Meaning:
137.442
Minimum:
94.03
jan 1, 2002
Maximum:
188.73
jan 1, 2009
At the date of observation
Value
Absolute change
Change from the previous value
jan 1, 2001
100.0
+100.0
0.0%
jan 1, 2002
94.03
-5.97
-5.97%
jan 1, 2003
111.069
+17.039
18.12%
jan 1, 2004
117.005
+5.936
5.34%
jan 1, 2005
141.159
+24.155
20.64%
jan 1, 2006
155.302
+14.143
10.02%
jan 1, 2007
158.291
+2.989
1.92%
jan 1, 2008
158.455
+0.164
0.1%
jan 1, 2009
188.73
+30.275
19.11%
jan 1, 2010
132.101
-56.629
-30.01%
jan 1, 2011
148.381
+16.28
12.32%
jan 1, 2012
129.902
-18.479
-12.45%
jan 1, 2013
134.016
+4.114
3.17%
jan 1, 2014
152.885
+18.869
14.08%
jan 1, 2015
153.199
+0.315
0.21%
jan 1, 2016
124.554
-28.645
-18.7%
Ranking of countries by current statistics by years