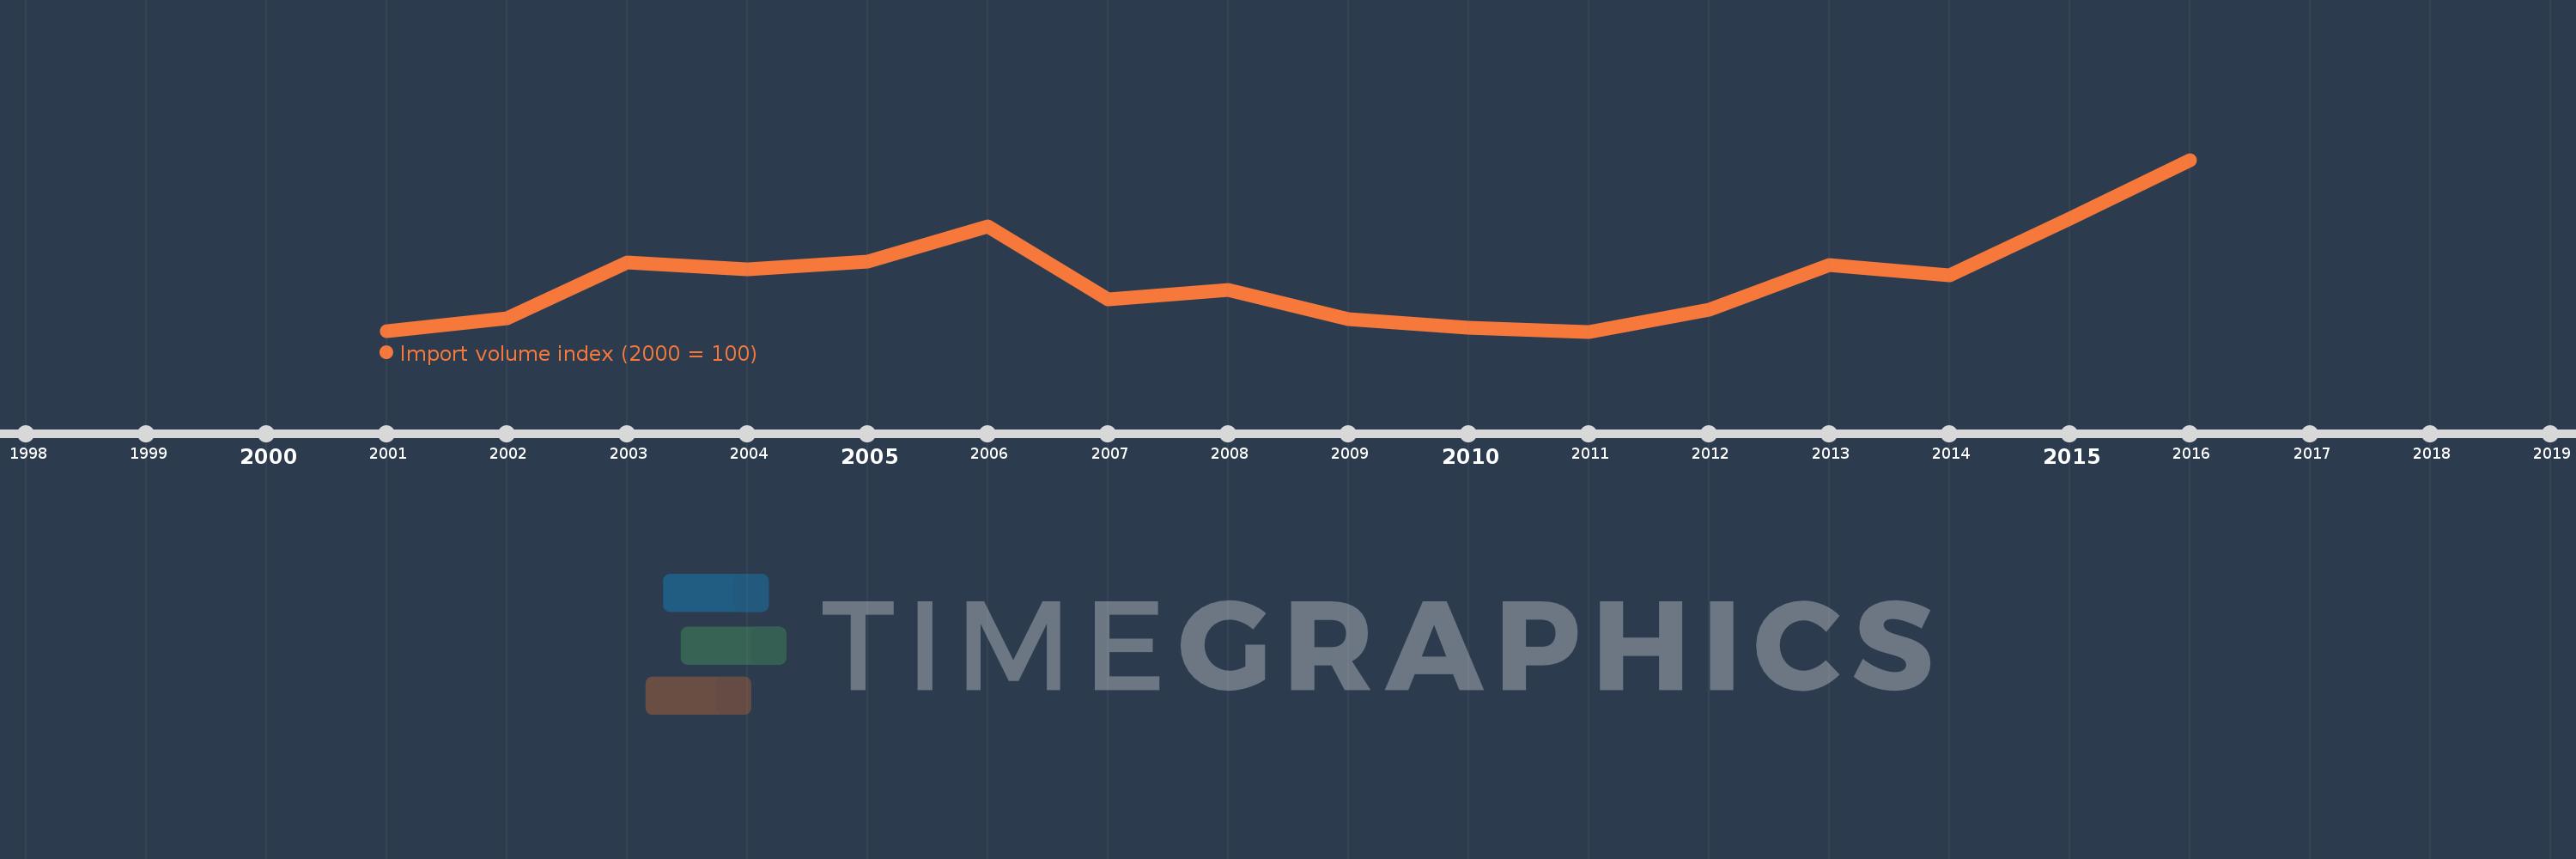
This timeline shows a graph from 2001 to 2016 of Kiribati. No data until 2000. Number of actual observations by date: 16.
Source name:
World Development Indicators
Source organization:
United Nations Conference on Trade and Development, Handbook of Statistics and data files, and International Monetary Fund, International Financial Statistics.
Categories, topics:
Private Sector, Trade
Last updated:
apr 23, 2017
Indicators value changes by year
Meaning:
124.1
Minimum:
99.917
jan 1, 2011
Maximum:
178.948
jan 1, 2016
At the date of observation
Value
Absolute change
Change from the previous value
jan 1, 2001
100.0
+100.0
0.0%
jan 1, 2002
105.997
+5.997
6.0%
jan 1, 2003
131.842
+25.846
24.38%
jan 1, 2004
128.571
-3.271
-2.48%
jan 1, 2005
132.038
+3.466
2.7%
jan 1, 2006
148.29
+16.252
12.31%
jan 1, 2007
114.925
-33.365
-22.5%
jan 1, 2008
119.224
+4.299
3.74%
jan 1, 2009
105.518
-13.706
-11.5%
jan 1, 2010
101.728
-3.79
-3.59%
jan 1, 2011
99.917
-1.811
-1.78%
jan 1, 2012
110.032
+10.115
10.12%
jan 1, 2013
130.612
+20.58
18.7%
jan 1, 2014
125.974
-4.638
-3.55%
jan 1, 2015
151.98
+26.006
20.64%
jan 1, 2016
178.948
+26.968
17.74%
Ranking of countries by current statistics by years