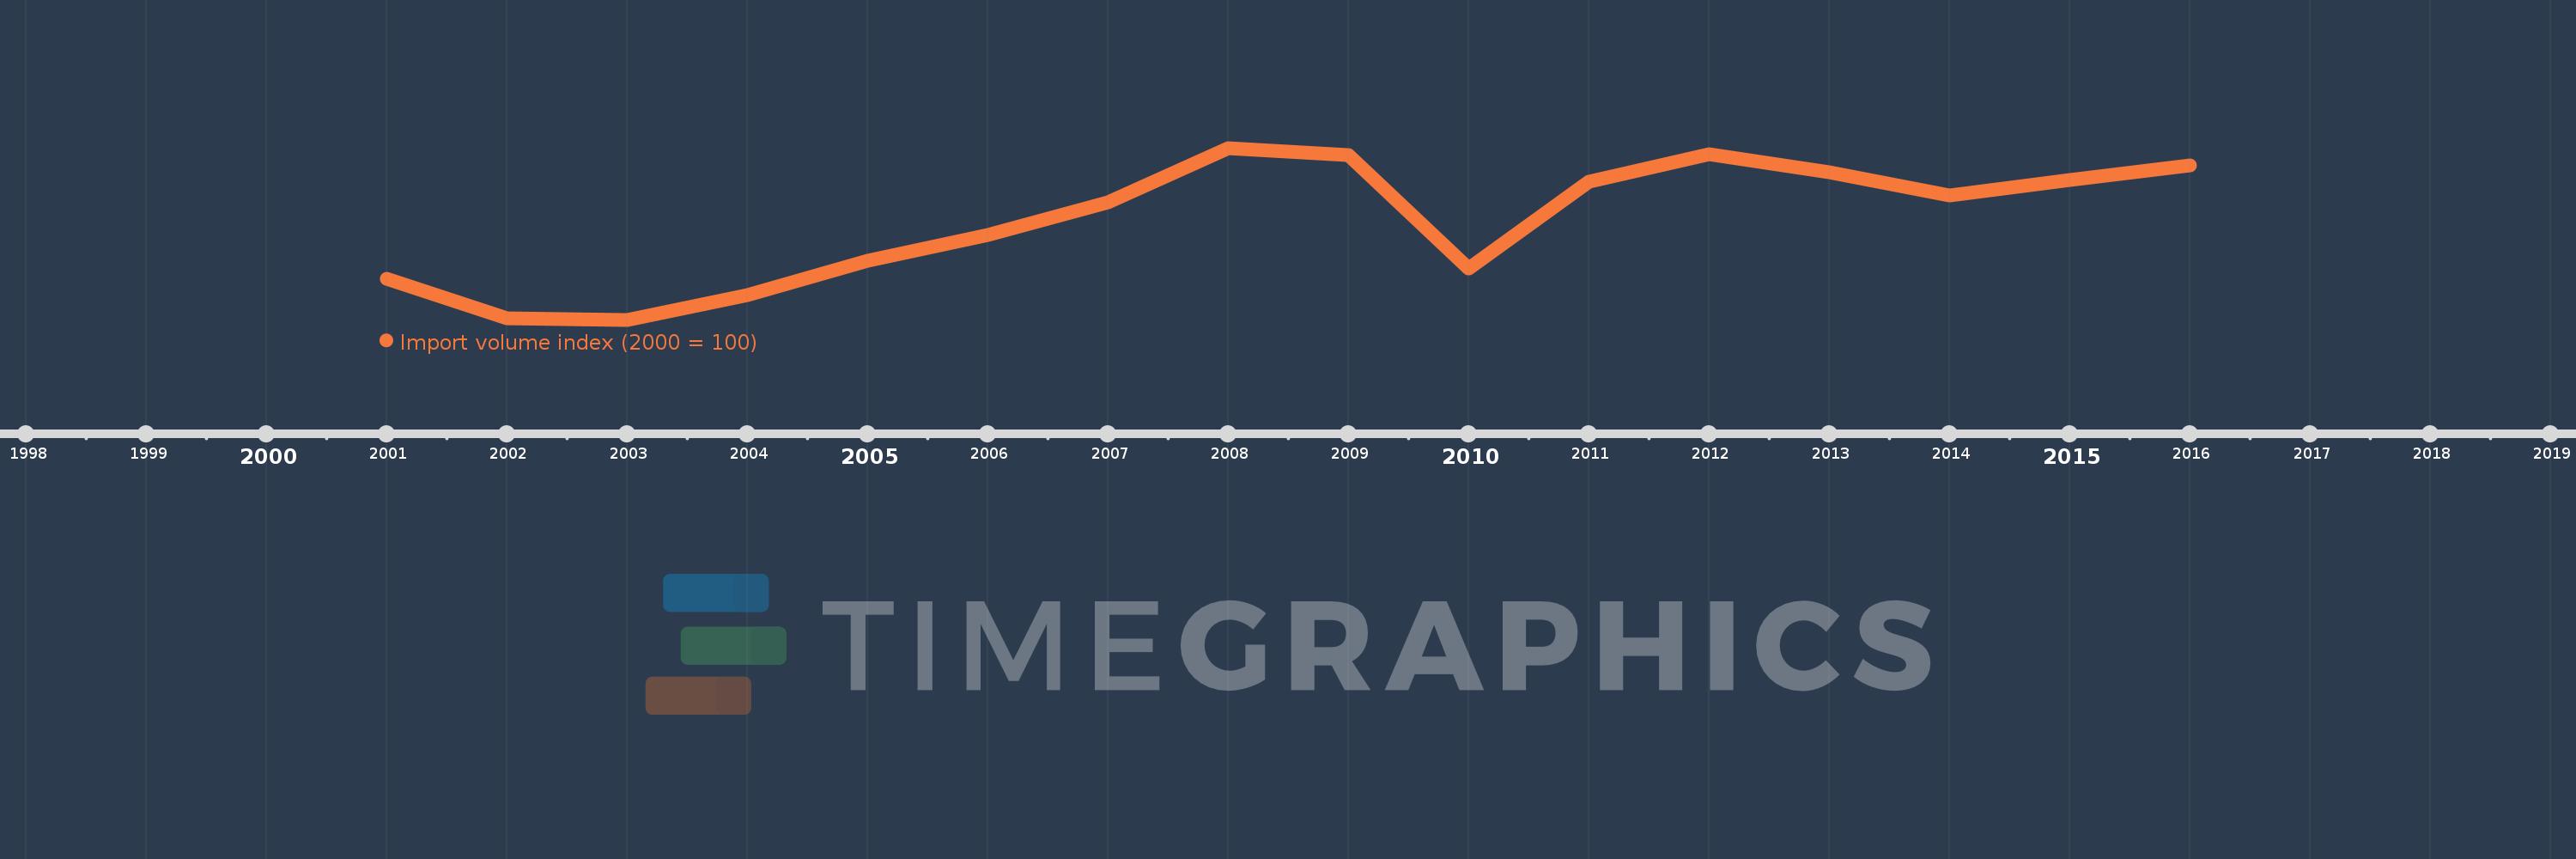
This timeline shows a graph from 2001 to 2016 of Sweden. No data until 2000. Number of actual observations by date: 16.
Source name:
World Development Indicators
Source organization:
United Nations Conference on Trade and Development, Handbook of Statistics and data files, and International Monetary Fund, International Financial Statistics.
Categories, topics:
Private Sector, Trade
Last updated:
apr 23, 2017
Indicators value changes by year
Meaning:
112.1
Minimum:
91.459
jan 1, 2003
Maximum:
127.252
jan 1, 2008
At the date of observation
Value
Absolute change
Change from the previous value
jan 1, 2001
100.0
+100.0
0.0%
jan 1, 2002
91.788
-8.212
-8.21%
jan 1, 2003
91.459
-0.328
-0.36%
jan 1, 2004
96.55
+5.091
5.57%
jan 1, 2005
103.734
+7.184
7.44%
jan 1, 2006
109.045
+5.311
5.12%
jan 1, 2007
115.937
+6.892
6.32%
jan 1, 2008
127.252
+11.315
9.76%
jan 1, 2009
125.806
-1.446
-1.14%
jan 1, 2010
102.212
-23.594
-18.75%
jan 1, 2011
120.287
+18.075
17.68%
jan 1, 2012
126.001
+5.714
4.75%
jan 1, 2013
122.111
-3.89
-3.09%
jan 1, 2014
117.3
-4.81
-3.94%
jan 1, 2015
120.532
+3.231
2.75%
jan 1, 2016
123.582
+3.05
2.53%
Ranking of countries by current statistics by years