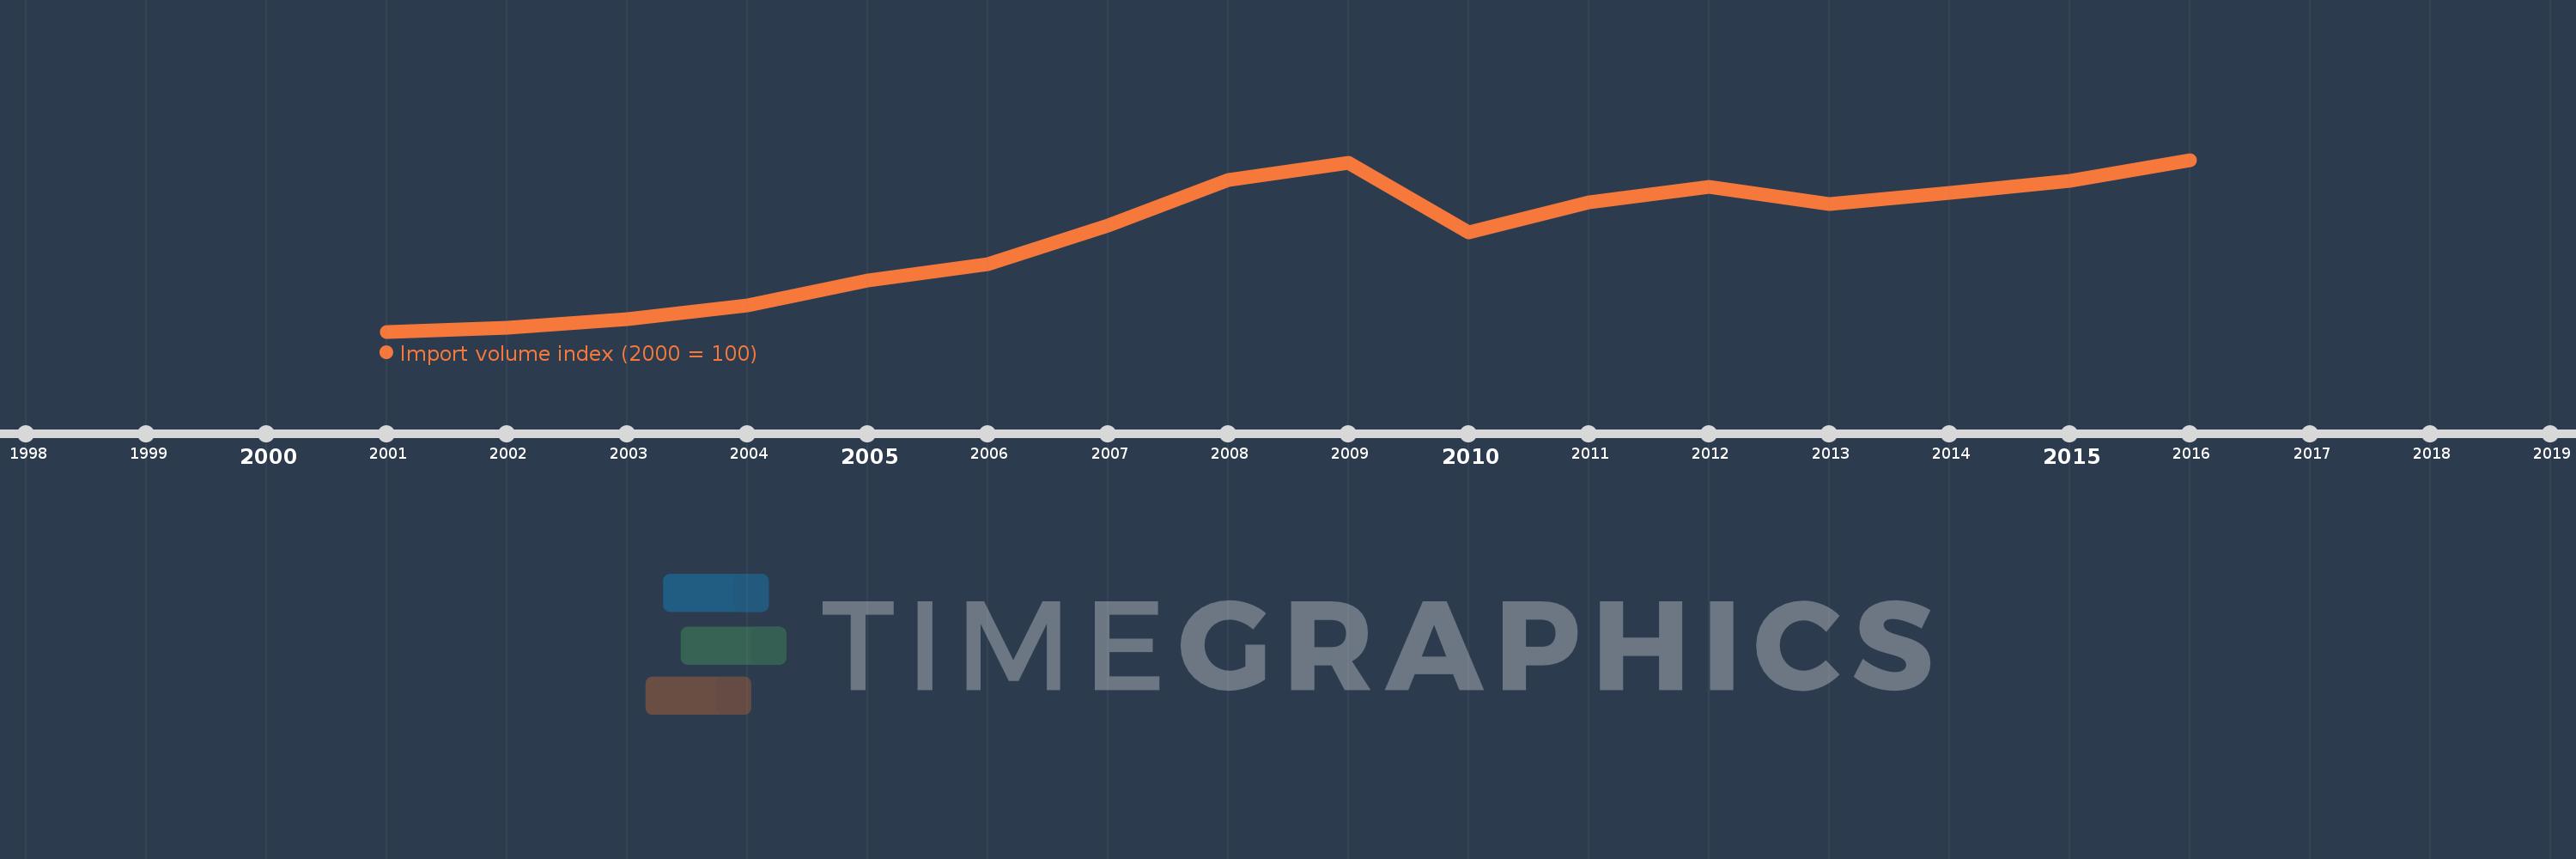
This timeline shows a graph from 2001 to 2016 of Slovenia. No data until 2000. Number of actual observations by date: 16.
Source name:
World Development Indicators
Source organization:
United Nations Conference on Trade and Development, Handbook of Statistics and data files, and International Monetary Fund, International Financial Statistics.
Categories, topics:
Private Sector, Trade
Last updated:
apr 23, 2017
Indicators value changes by year
Meaning:
148.266
Minimum:
100.0
jan 1, 2001
Maximum:
185.601
jan 1, 2016
At the date of observation
Value
Absolute change
Change from the previous value
jan 1, 2001
100.0
+100.0
0.0%
jan 1, 2002
101.81
+1.81
1.81%
jan 1, 2003
106.12
+4.309
4.23%
jan 1, 2004
113.082
+6.963
6.56%
jan 1, 2005
125.444
+12.362
10.93%
jan 1, 2006
133.698
+8.254
6.58%
jan 1, 2007
153.004
+19.306
14.44%
jan 1, 2008
175.605
+22.601
14.77%
jan 1, 2009
184.012
+8.407
4.79%
jan 1, 2010
149.409
-34.603
-18.8%
jan 1, 2011
164.219
+14.81
9.91%
jan 1, 2012
172.321
+8.103
4.93%
jan 1, 2013
163.664
-8.657
-5.02%
jan 1, 2014
168.988
+5.323
3.25%
jan 1, 2015
175.272
+6.284
3.72%
jan 1, 2016
185.601
+10.329
5.89%
Ranking of countries by current statistics by years