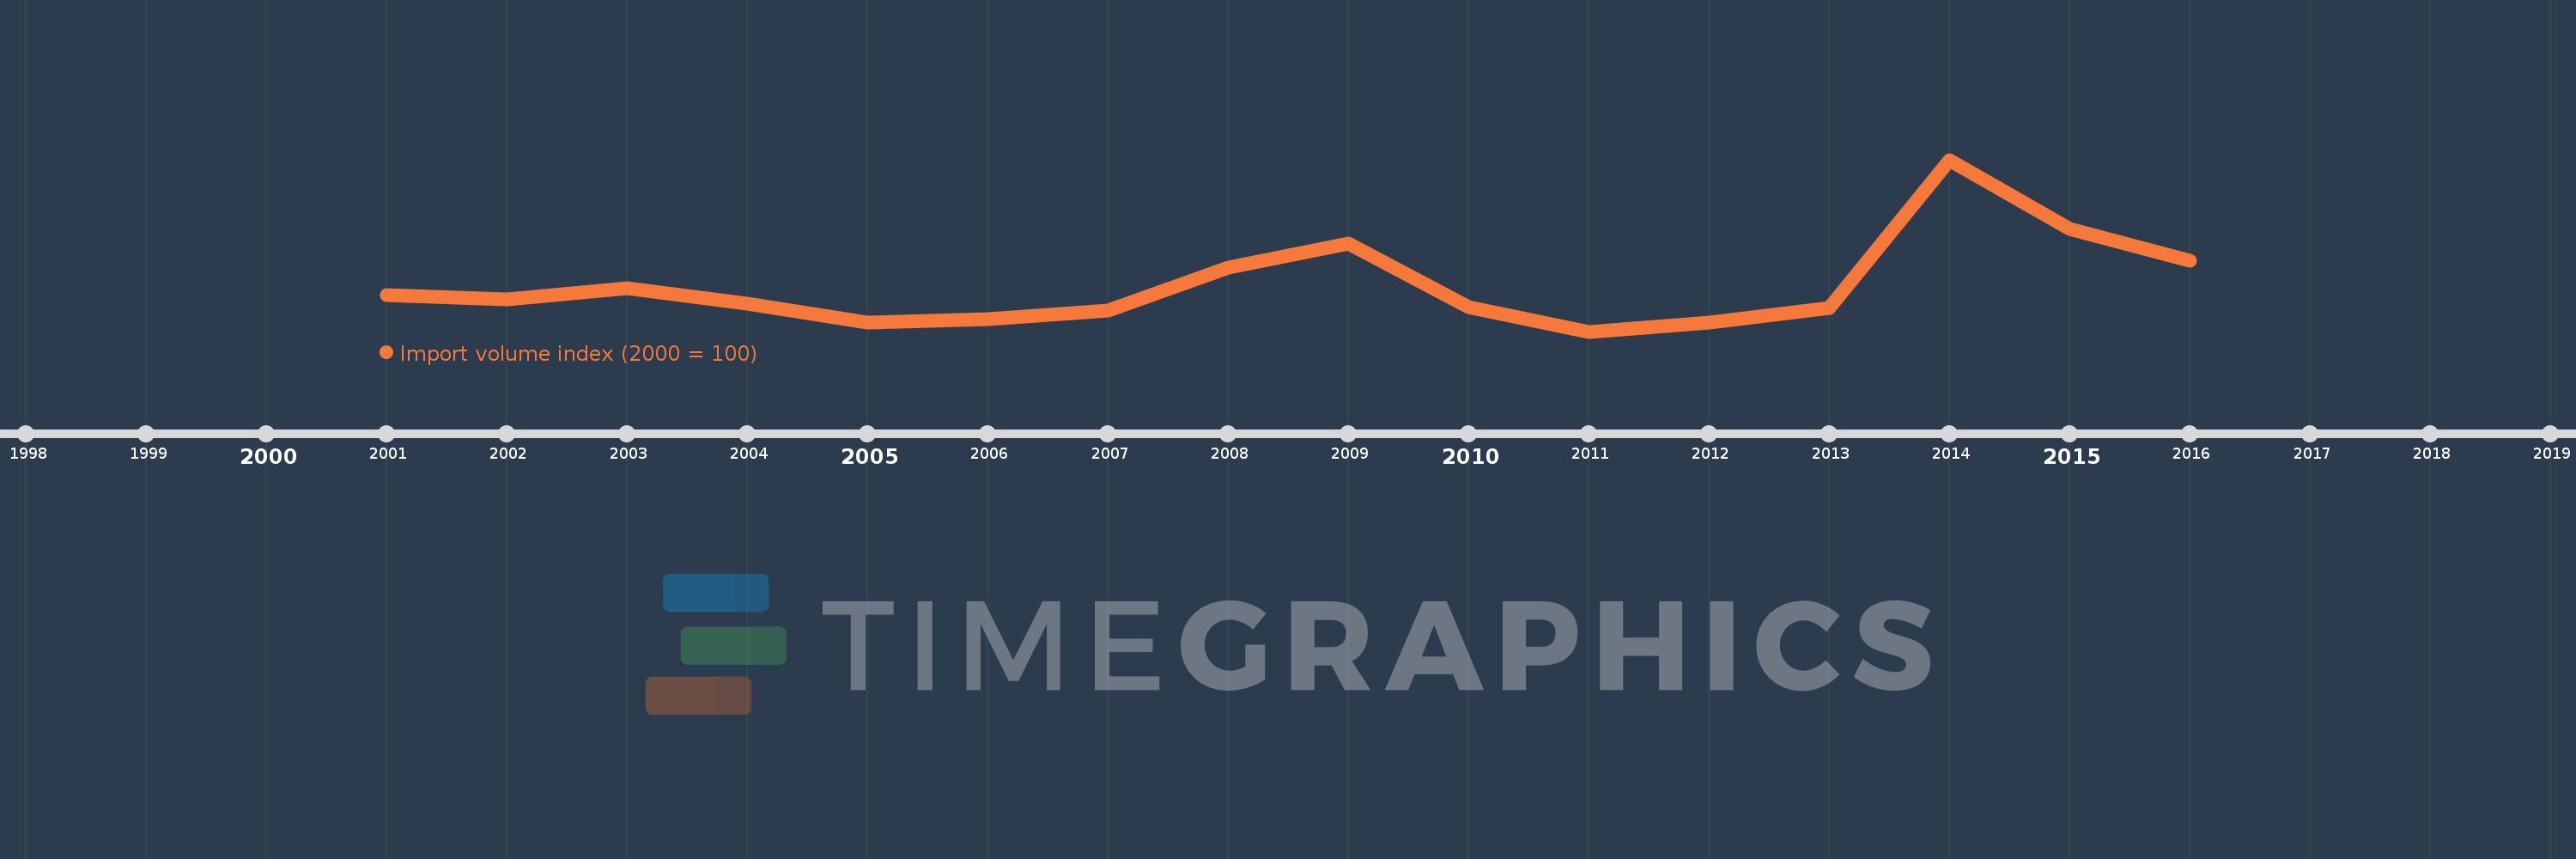
This timeline shows a graph from 2001 to 2016 of Nauru. No data until 2000. Number of actual observations by date: 16.
Source name:
World Development Indicators
Source organization:
United Nations Conference on Trade and Development, Handbook of Statistics and data files, and International Monetary Fund, International Financial Statistics.
Categories, topics:
Private Sector, Trade
Last updated:
apr 23, 2017
Indicators value changes by year
Meaning:
112.978
Minimum:
49.213
jan 1, 2011
Maximum:
286.932
jan 1, 2014
At the date of observation
Value
Absolute change
Change from the previous value
jan 1, 2001
100.0
+100.0
0.0%
jan 1, 2002
93.713
-6.287
-6.29%
jan 1, 2003
109.551
+15.838
16.9%
jan 1, 2004
88.336
-21.215
-19.37%
jan 1, 2005
61.976
-26.36
-29.84%
jan 1, 2006
66.572
+4.596
7.42%
jan 1, 2007
78.104
+11.533
17.32%
jan 1, 2008
137.766
+59.662
76.39%
jan 1, 2009
171.351
+33.585
24.38%
jan 1, 2010
82.899
-88.453
-51.62%
jan 1, 2011
49.213
-33.686
-40.64%
jan 1, 2012
61.26
+12.048
24.48%
jan 1, 2013
81.599
+20.339
33.2%
jan 1, 2014
286.932
+205.332
251.64%
jan 1, 2015
191.612
-95.319
-33.22%
jan 1, 2016
146.764
-44.848
-23.41%
Ranking of countries by current statistics by years