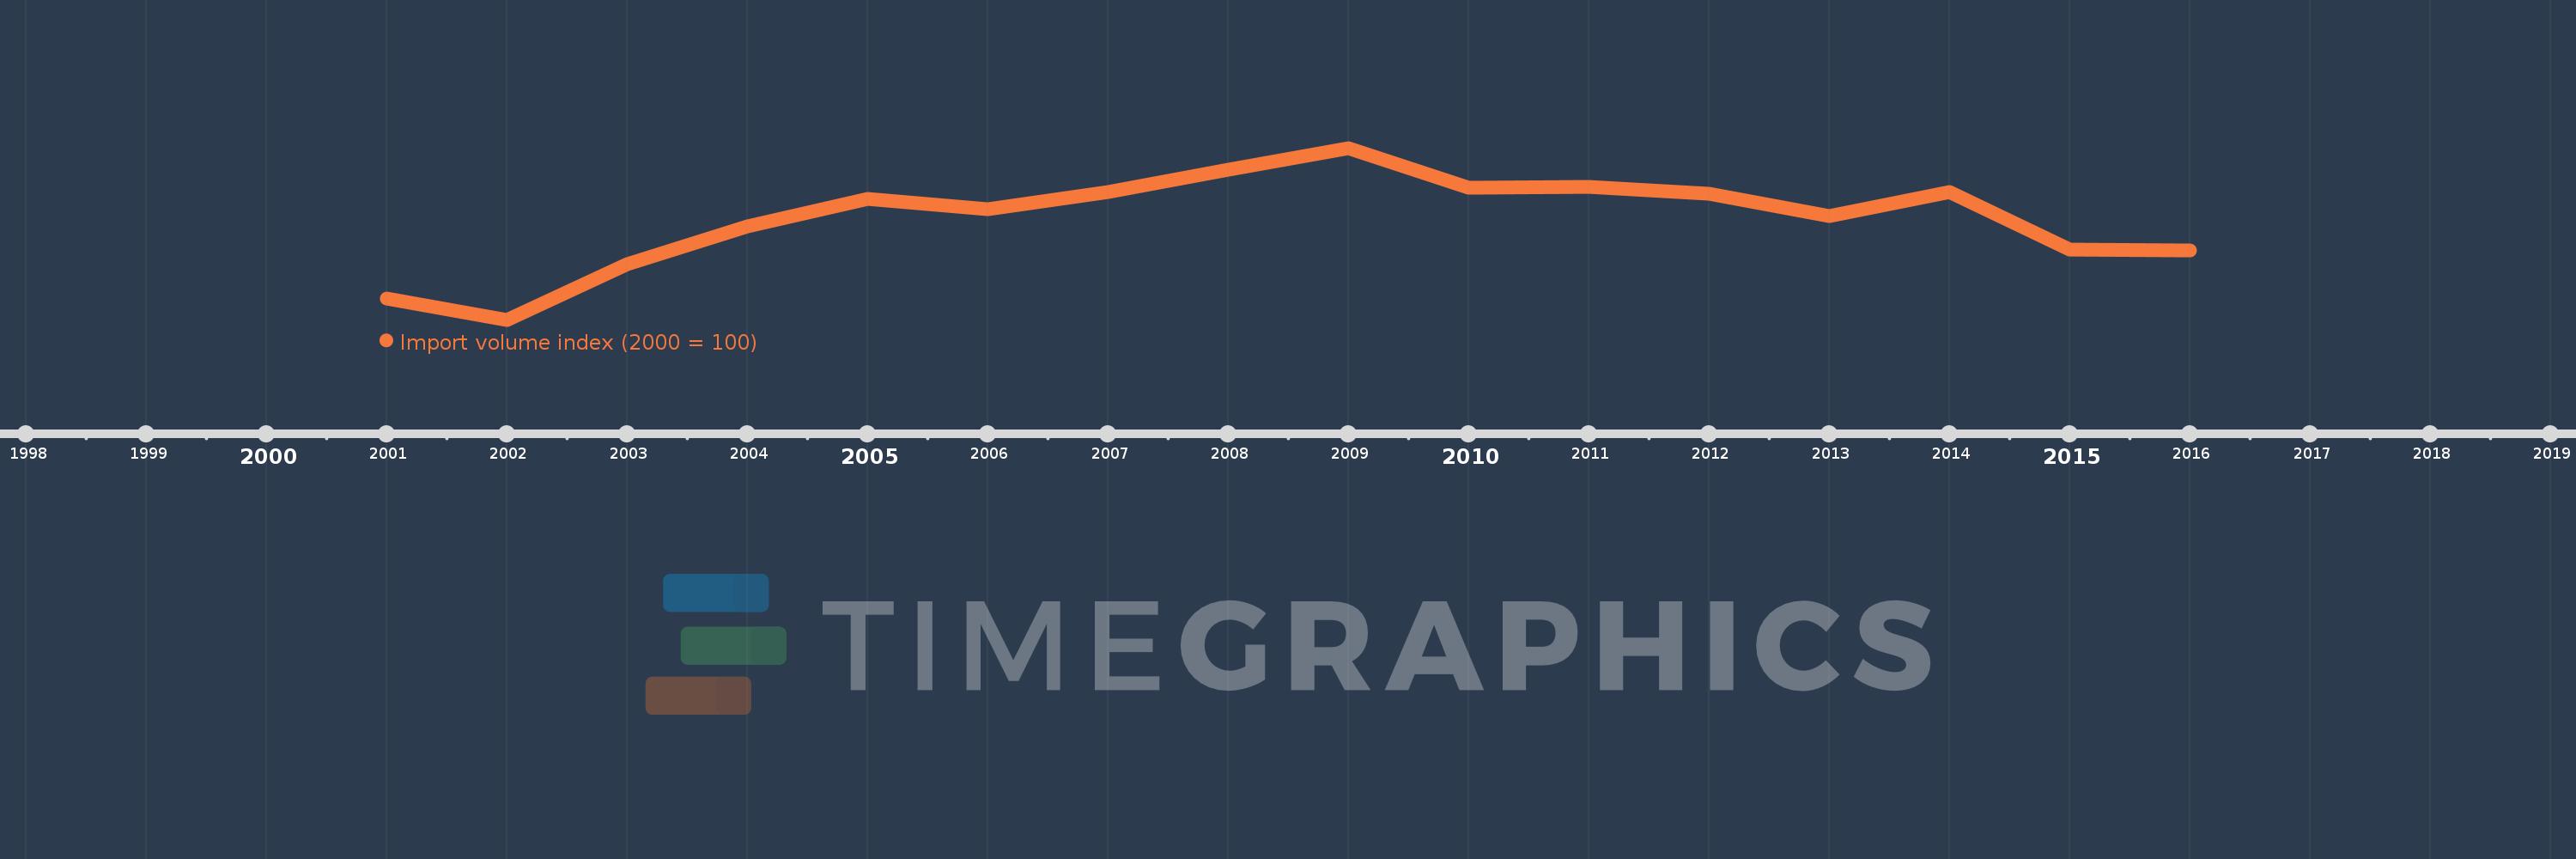
This timeline shows a graph from 2001 to 2016 of Greenland. No data until 2000. Number of actual observations by date: 16.
Source name:
World Development Indicators
Source organization:
United Nations Conference on Trade and Development, Handbook of Statistics and data files, and International Monetary Fund, International Financial Statistics.
Categories, topics:
Private Sector, Trade
Last updated:
apr 23, 2017
Indicators value changes by year
Meaning:
129.114
Minimum:
92.12
jan 1, 2002
Maximum:
155.088
jan 1, 2009
At the date of observation
Value
Absolute change
Change from the previous value
jan 1, 2001
100.0
+100.0
0.0%
jan 1, 2002
92.12
-7.88
-7.88%
jan 1, 2003
112.35
+20.23
21.96%
jan 1, 2004
126.434
+14.084
12.54%
jan 1, 2005
136.505
+10.071
7.97%
jan 1, 2006
132.701
-3.803
-2.79%
jan 1, 2007
139.062
+6.361
4.79%
jan 1, 2008
147.267
+8.205
5.9%
jan 1, 2009
155.088
+7.821
5.31%
jan 1, 2010
140.44
-14.648
-9.45%
jan 1, 2011
140.948
+0.508
0.36%
jan 1, 2012
138.169
-2.779
-1.97%
jan 1, 2013
130.277
-7.892
-5.71%
jan 1, 2014
139.068
+8.791
6.75%
jan 1, 2015
117.805
-21.263
-15.29%
jan 1, 2016
117.597
-0.208
-0.18%
Ranking of countries by current statistics by years