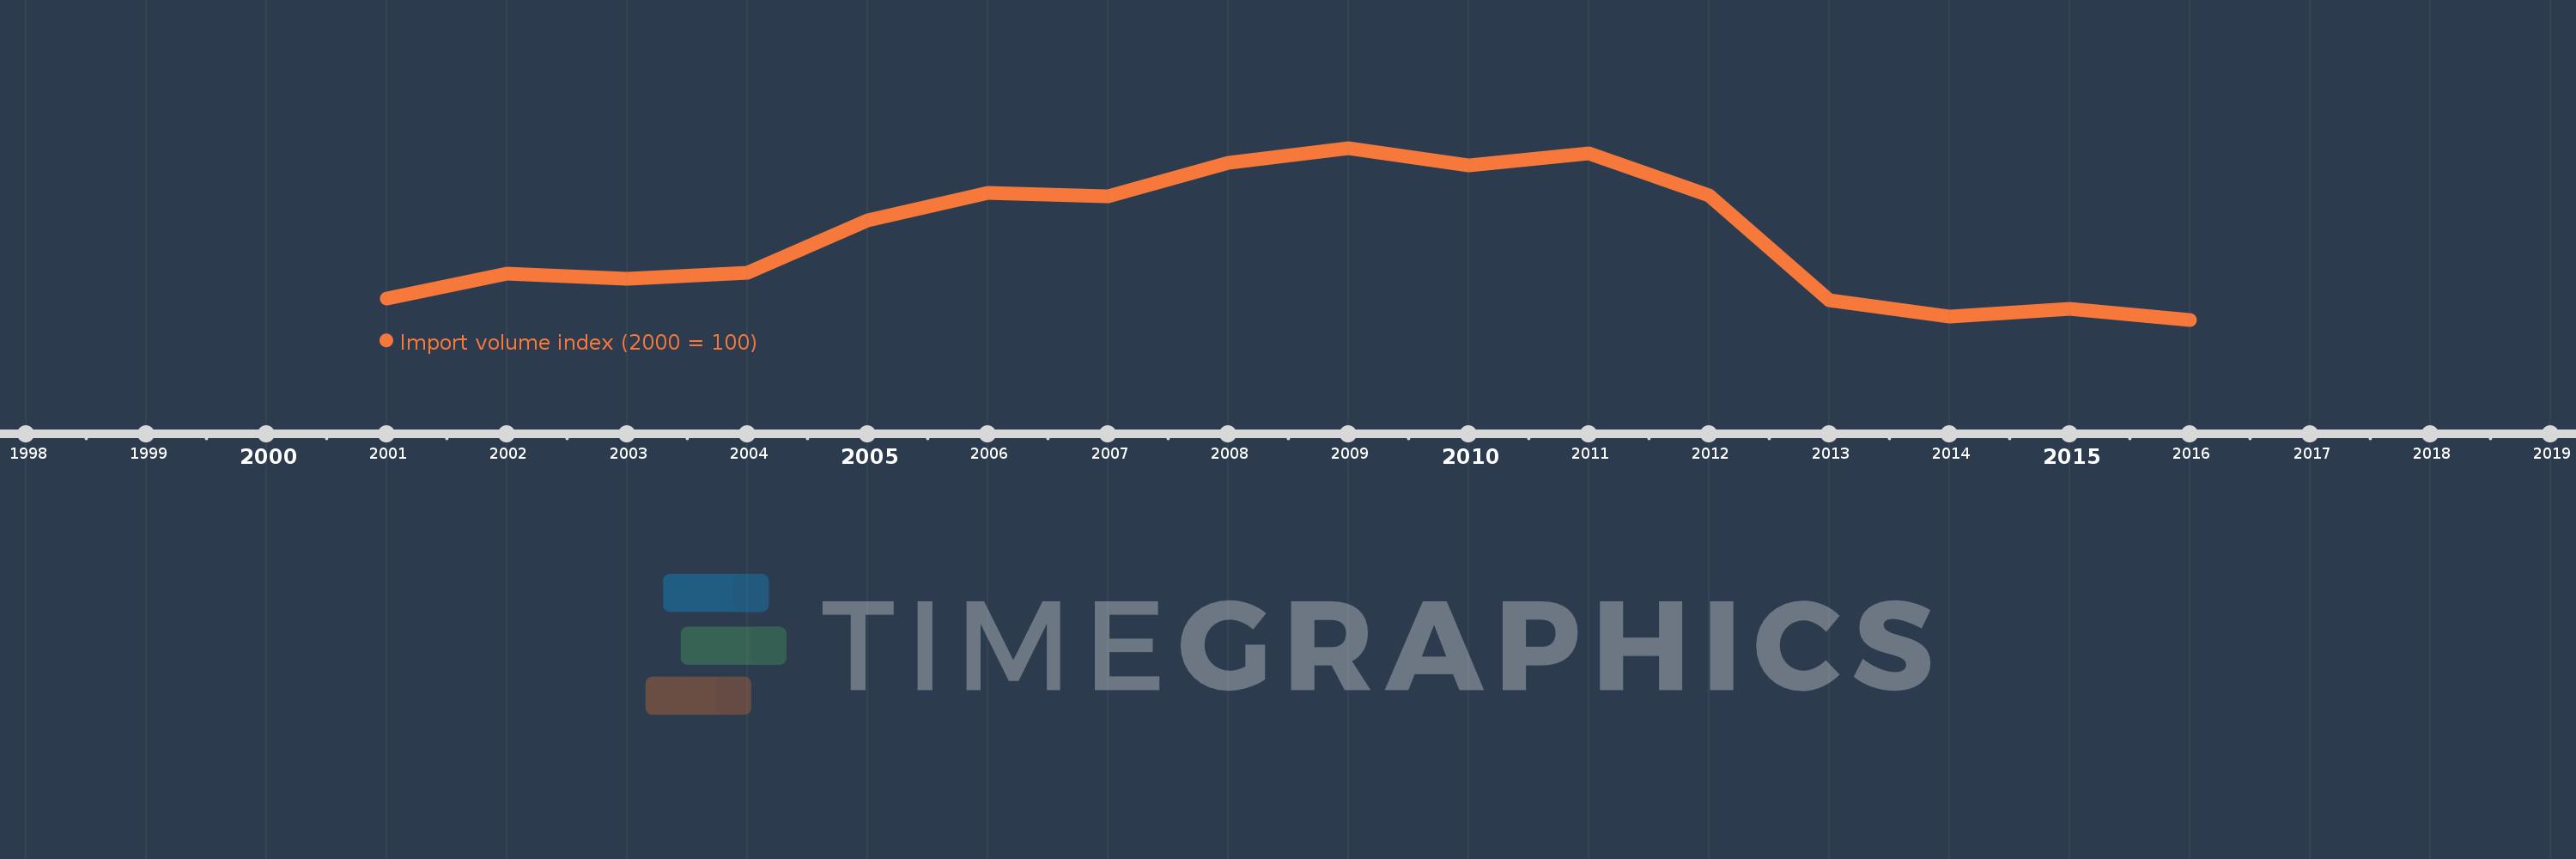
This timeline shows a graph from 2001 to 2016 of Syrian Arab Republic. No data until 2000. Number of actual observations by date: 16.
Source name:
World Development Indicators
Source organization:
United Nations Conference on Trade and Development, Handbook of Statistics and data files, and International Monetary Fund, International Financial Statistics.
Categories, topics:
Private Sector, Trade
Last updated:
apr 23, 2017
Indicators value changes by year
Meaning:
170.952
Minimum:
74.873
jan 1, 2016
Maximum:
276.014
jan 1, 2009
At the date of observation
Value
Absolute change
Change from the previous value
jan 1, 2001
100.0
+100.0
0.0%
jan 1, 2002
129.005
+29.005
29.01%
jan 1, 2003
122.69
-6.315
-4.9%
jan 1, 2004
129.896
+7.206
5.87%
jan 1, 2005
190.901
+61.005
46.96%
jan 1, 2006
223.795
+32.894
17.23%
jan 1, 2007
219.019
-4.776
-2.13%
jan 1, 2008
258.786
+39.767
18.16%
jan 1, 2009
276.014
+17.228
6.66%
jan 1, 2010
255.847
-20.167
-7.31%
jan 1, 2011
269.366
+13.519
5.28%
jan 1, 2012
220.593
-48.773
-18.11%
jan 1, 2013
97.642
-122.951
-55.74%
jan 1, 2014
78.873
-18.769
-19.22%
jan 1, 2015
87.924
+9.051
11.47%
jan 1, 2016
74.873
-13.051
-14.84%
Ranking of countries by current statistics by years