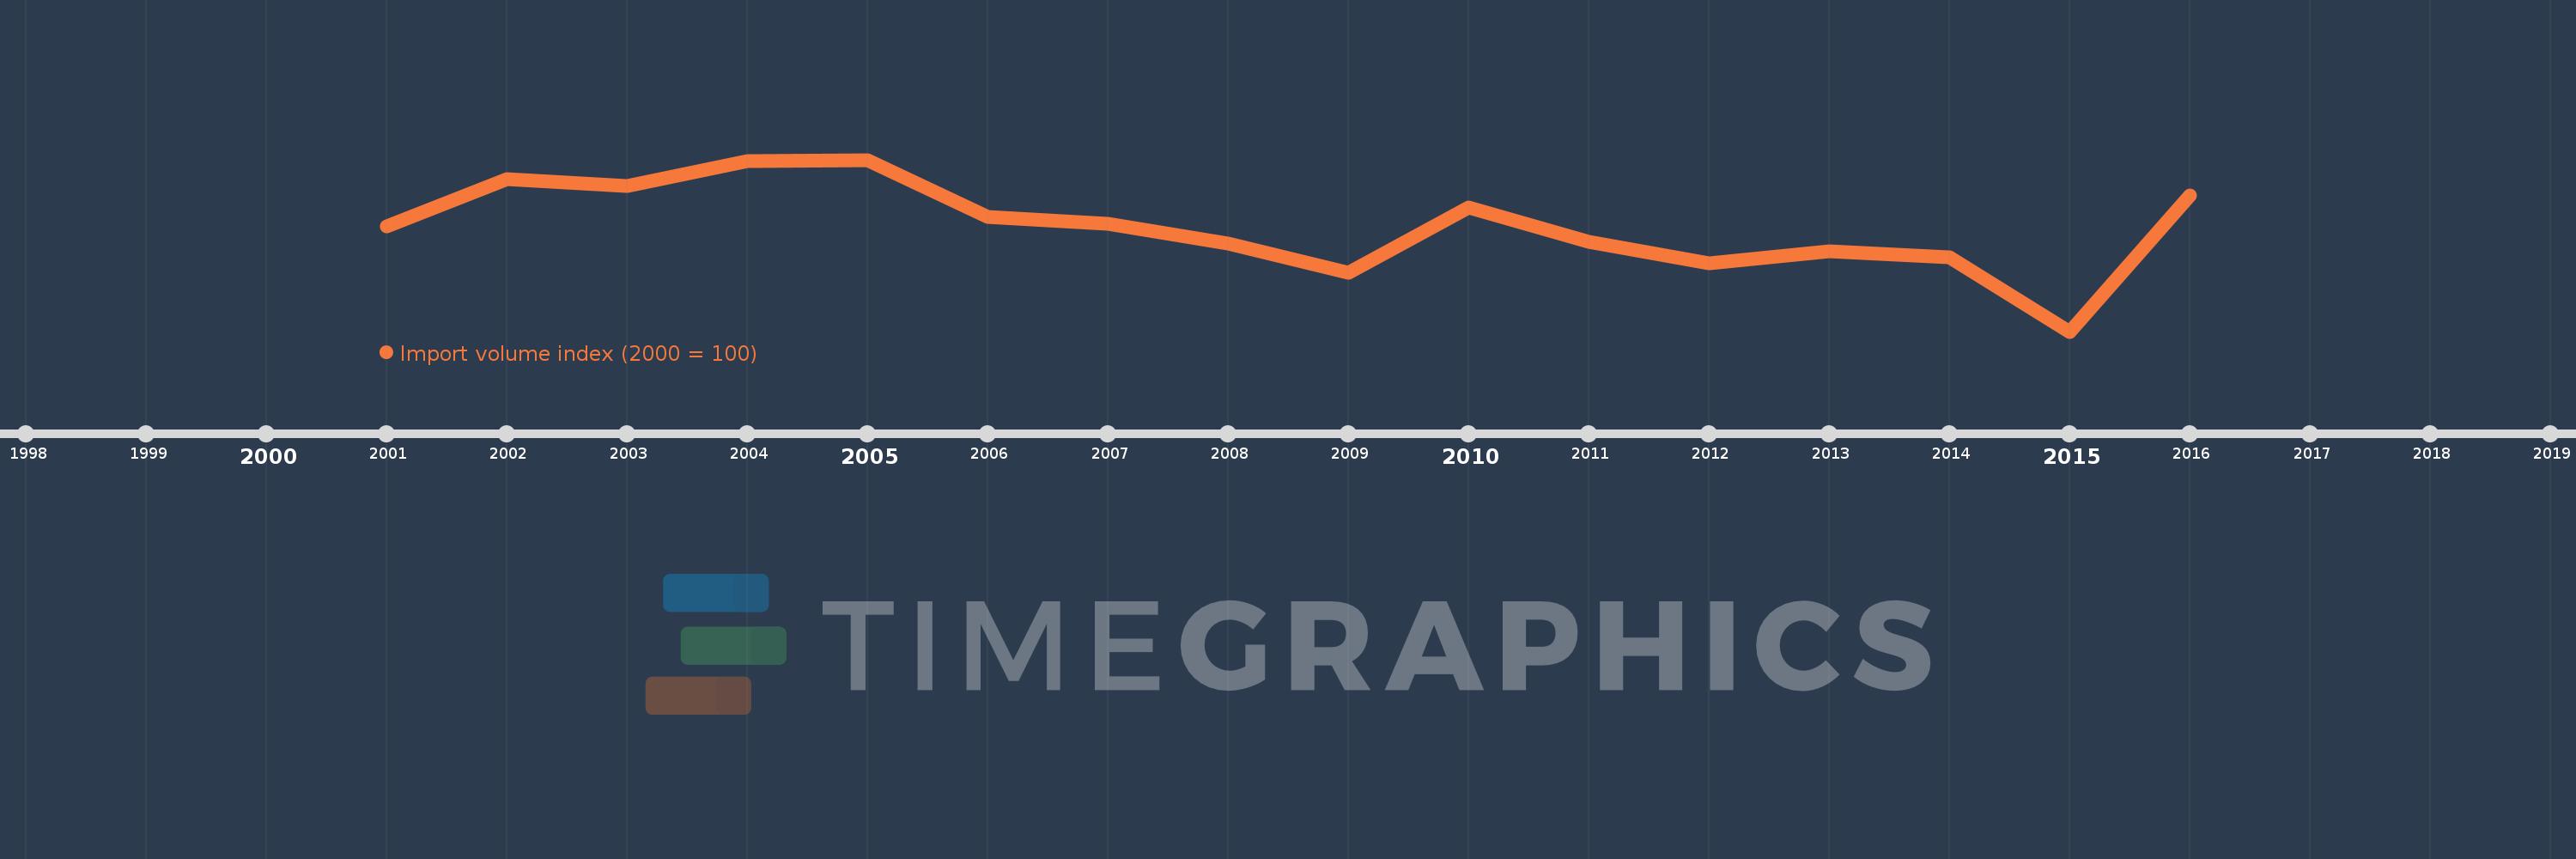
This timeline shows a graph from 2001 to 2016 of Micronesia, Fed. Sts.. No data until 2000. Number of actual observations by date: 16.
Source name:
World Development Indicators
Source organization:
United Nations Conference on Trade and Development, Handbook of Statistics and data files, and International Monetary Fund, International Financial Statistics.
Categories, topics:
Private Sector, Trade
Last updated:
apr 23, 2017
Indicators value changes by year
Meaning:
100.026
Minimum:
77.136
jan 1, 2015
Maximum:
114.395
jan 1, 2005
At the date of observation
Value
Absolute change
Change from the previous value
jan 1, 2001
100.0
+100.0
0.0%
jan 1, 2002
110.27
+10.27
10.27%
jan 1, 2003
108.78
-1.49
-1.35%
jan 1, 2004
114.154
+5.374
4.94%
jan 1, 2005
114.395
+0.241
0.21%
jan 1, 2006
101.992
-12.403
-10.84%
jan 1, 2007
100.55
-1.442
-1.41%
jan 1, 2008
96.317
-4.232
-4.21%
jan 1, 2009
89.881
-6.436
-6.68%
jan 1, 2010
103.987
+14.106
15.69%
jan 1, 2011
96.528
-7.459
-7.17%
jan 1, 2012
91.995
-4.533
-4.7%
jan 1, 2013
94.523
+2.528
2.75%
jan 1, 2014
93.201
-1.322
-1.4%
jan 1, 2015
77.136
-16.065
-17.24%
jan 1, 2016
106.713
+29.577
38.34%
Ranking of countries by current statistics by years