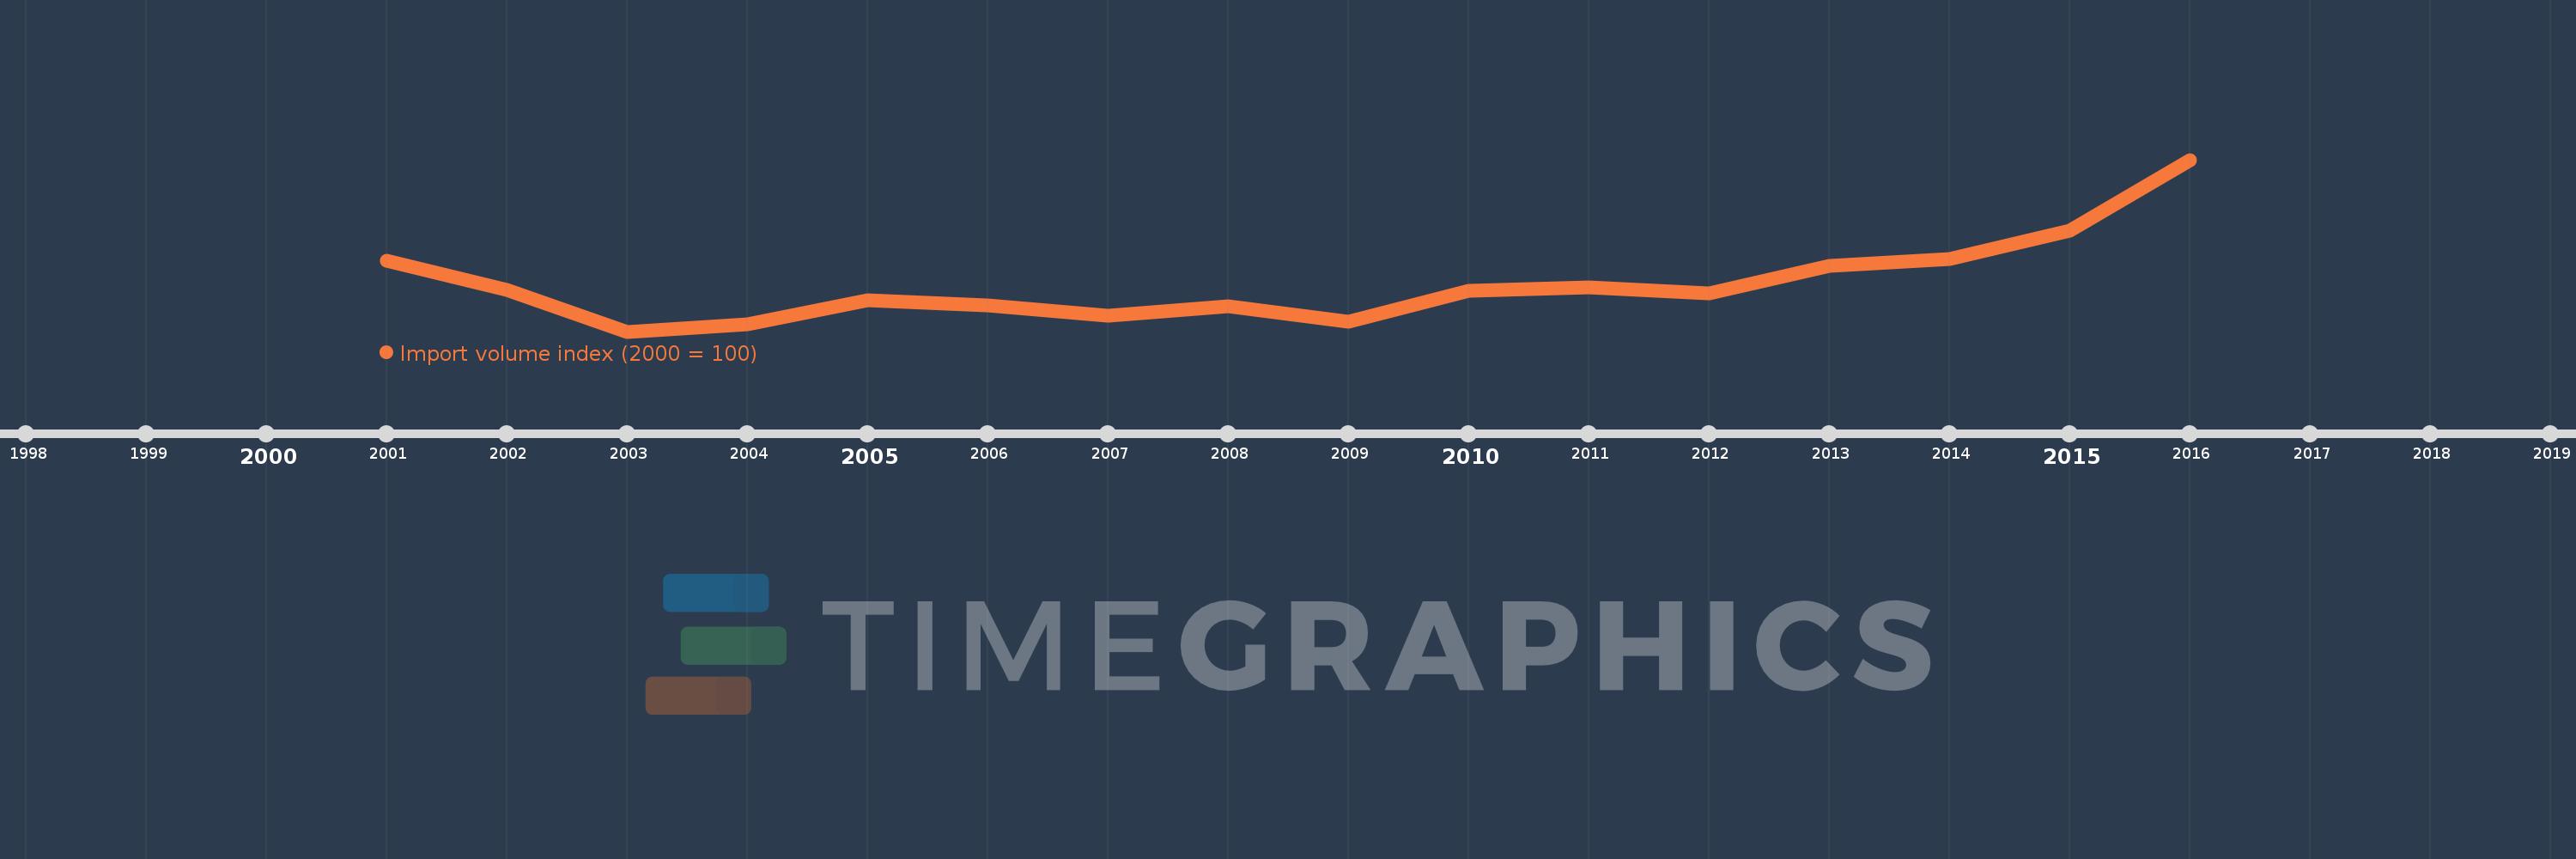
This timeline shows a graph from 2001 to 2016 of West Bank and Gaza. No data until 2000. Number of actual observations by date: 16.
Source name:
World Development Indicators
Source organization:
United Nations Conference on Trade and Development, Handbook of Statistics and data files, and International Monetary Fund, International Financial Statistics.
Categories, topics:
Private Sector, Trade
Last updated:
apr 23, 2017
Indicators value changes by year
Meaning:
88.549
Minimum:
65.034
jan 1, 2003
Maximum:
149.82
jan 1, 2016
At the date of observation
Value
Absolute change
Change from the previous value
jan 1, 2001
100.0
+100.0
0.0%
jan 1, 2002
85.52
-14.48
-14.48%
jan 1, 2003
65.034
-20.487
-23.96%
jan 1, 2004
68.627
+3.593
5.52%
jan 1, 2005
80.6
+11.973
17.45%
jan 1, 2006
78.146
-2.454
-3.04%
jan 1, 2007
72.684
-5.462
-6.99%
jan 1, 2008
77.491
+4.807
6.61%
jan 1, 2009
70.065
-7.426
-9.58%
jan 1, 2010
84.983
+14.918
21.29%
jan 1, 2011
86.981
+1.998
2.35%
jan 1, 2012
83.94
-3.04
-3.5%
jan 1, 2013
97.387
+13.446
16.02%
jan 1, 2014
100.803
+3.417
3.51%
jan 1, 2015
114.7
+13.897
13.79%
jan 1, 2016
149.82
+35.12
30.62%
Ranking of countries by current statistics by years