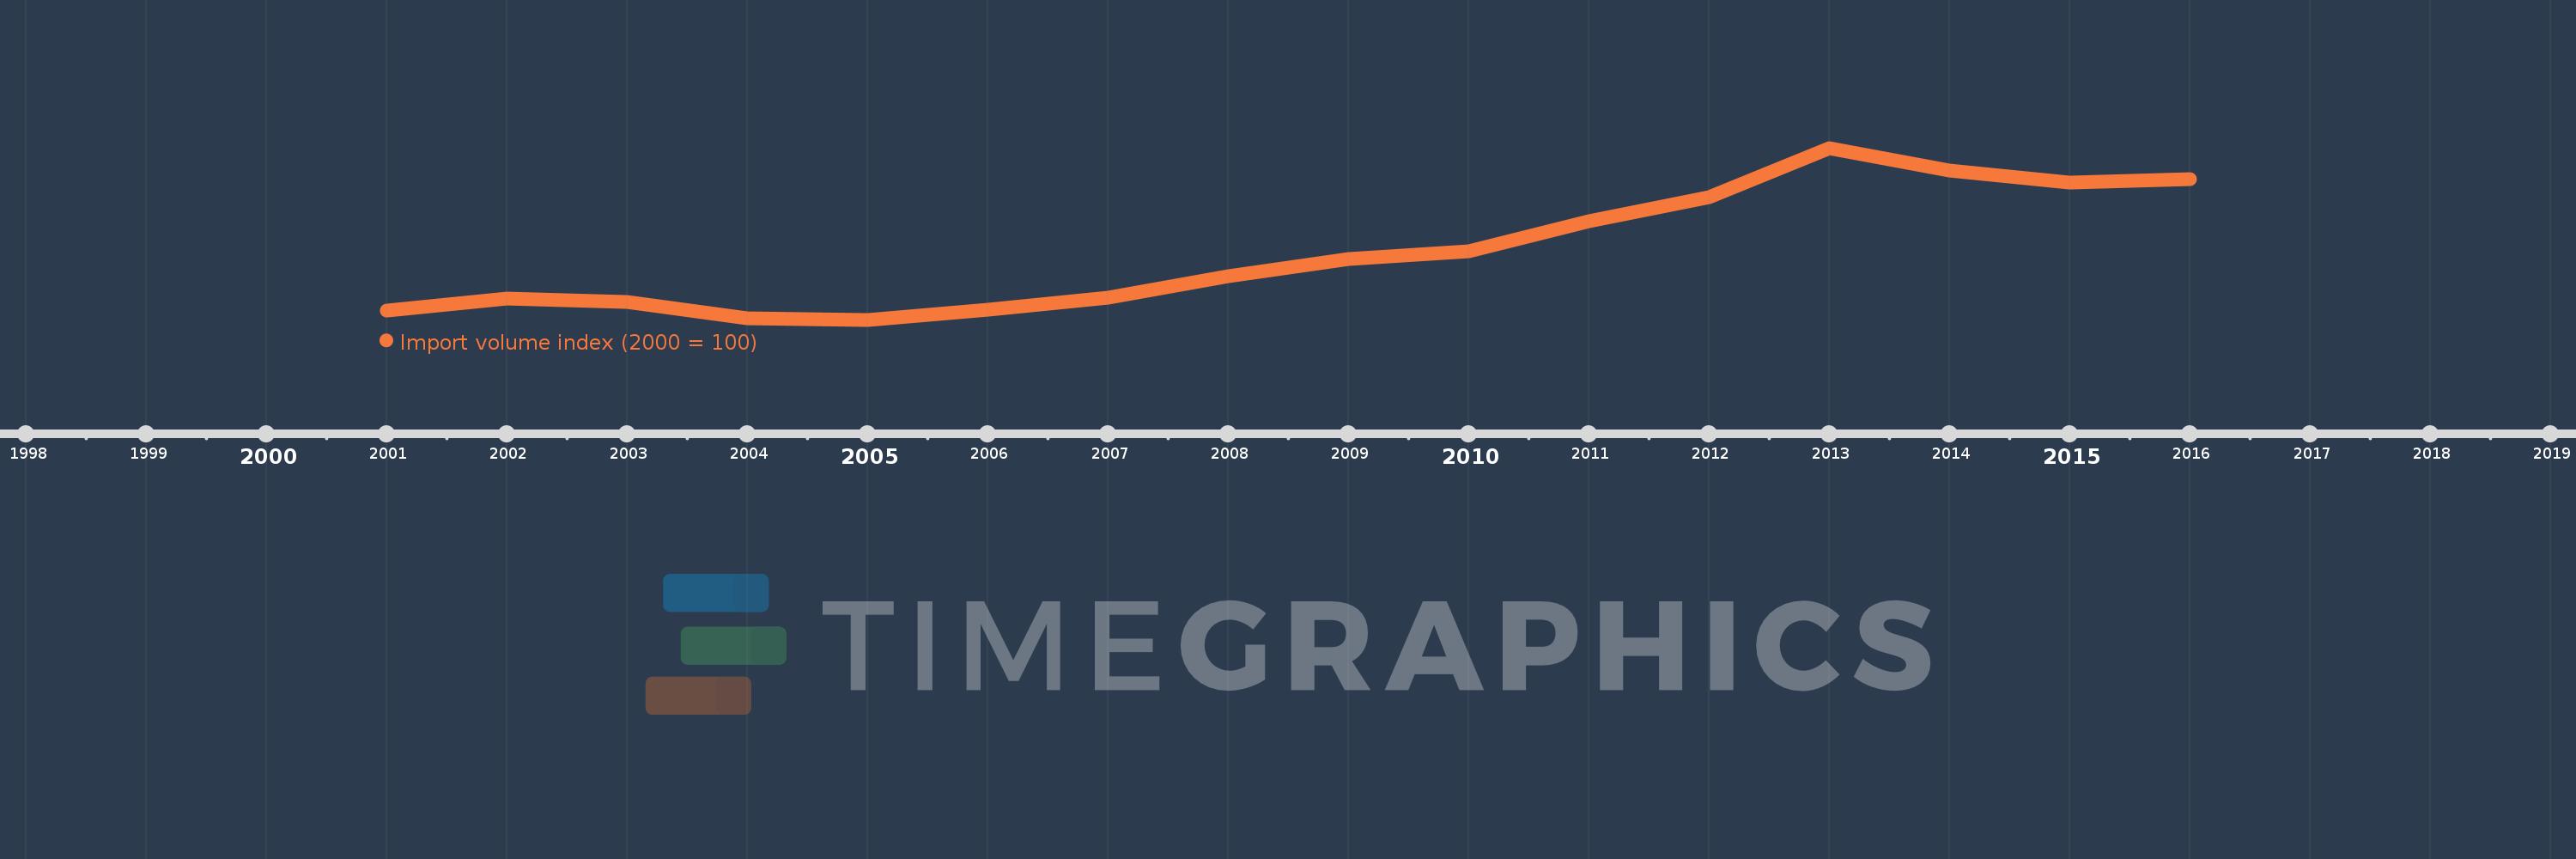
This timeline shows a graph from 2001 to 2016 of Guyana. No data until 2000. Number of actual observations by date: 16.
Source name:
World Development Indicators
Source organization:
United Nations Conference on Trade and Development, Handbook of Statistics and data files, and International Monetary Fund, International Financial Statistics.
Categories, topics:
Private Sector, Trade
Last updated:
apr 23, 2017
Indicators value changes by year
Meaning:
123.263
Minimum:
96.218
jan 1, 2005
Maximum:
165.374
jan 1, 2013
At the date of observation
Value
Absolute change
Change from the previous value
jan 1, 2001
100.0
+100.0
0.0%
jan 1, 2002
104.884
+4.884
4.88%
jan 1, 2003
103.25
-1.634
-1.56%
jan 1, 2004
96.682
-6.568
-6.36%
jan 1, 2005
96.218
-0.464
-0.48%
jan 1, 2006
100.285
+4.067
4.23%
jan 1, 2007
105.033
+4.748
4.73%
jan 1, 2008
113.872
+8.84
8.42%
jan 1, 2009
120.685
+6.812
5.98%
jan 1, 2010
123.745
+3.061
2.54%
jan 1, 2011
135.969
+12.224
9.88%
jan 1, 2012
145.546
+9.577
7.04%
jan 1, 2013
165.374
+19.827
13.62%
jan 1, 2014
156.432
-8.942
-5.41%
jan 1, 2015
151.375
-5.056
-3.23%
jan 1, 2016
152.853
+1.478
0.98%
Ranking of countries by current statistics by years