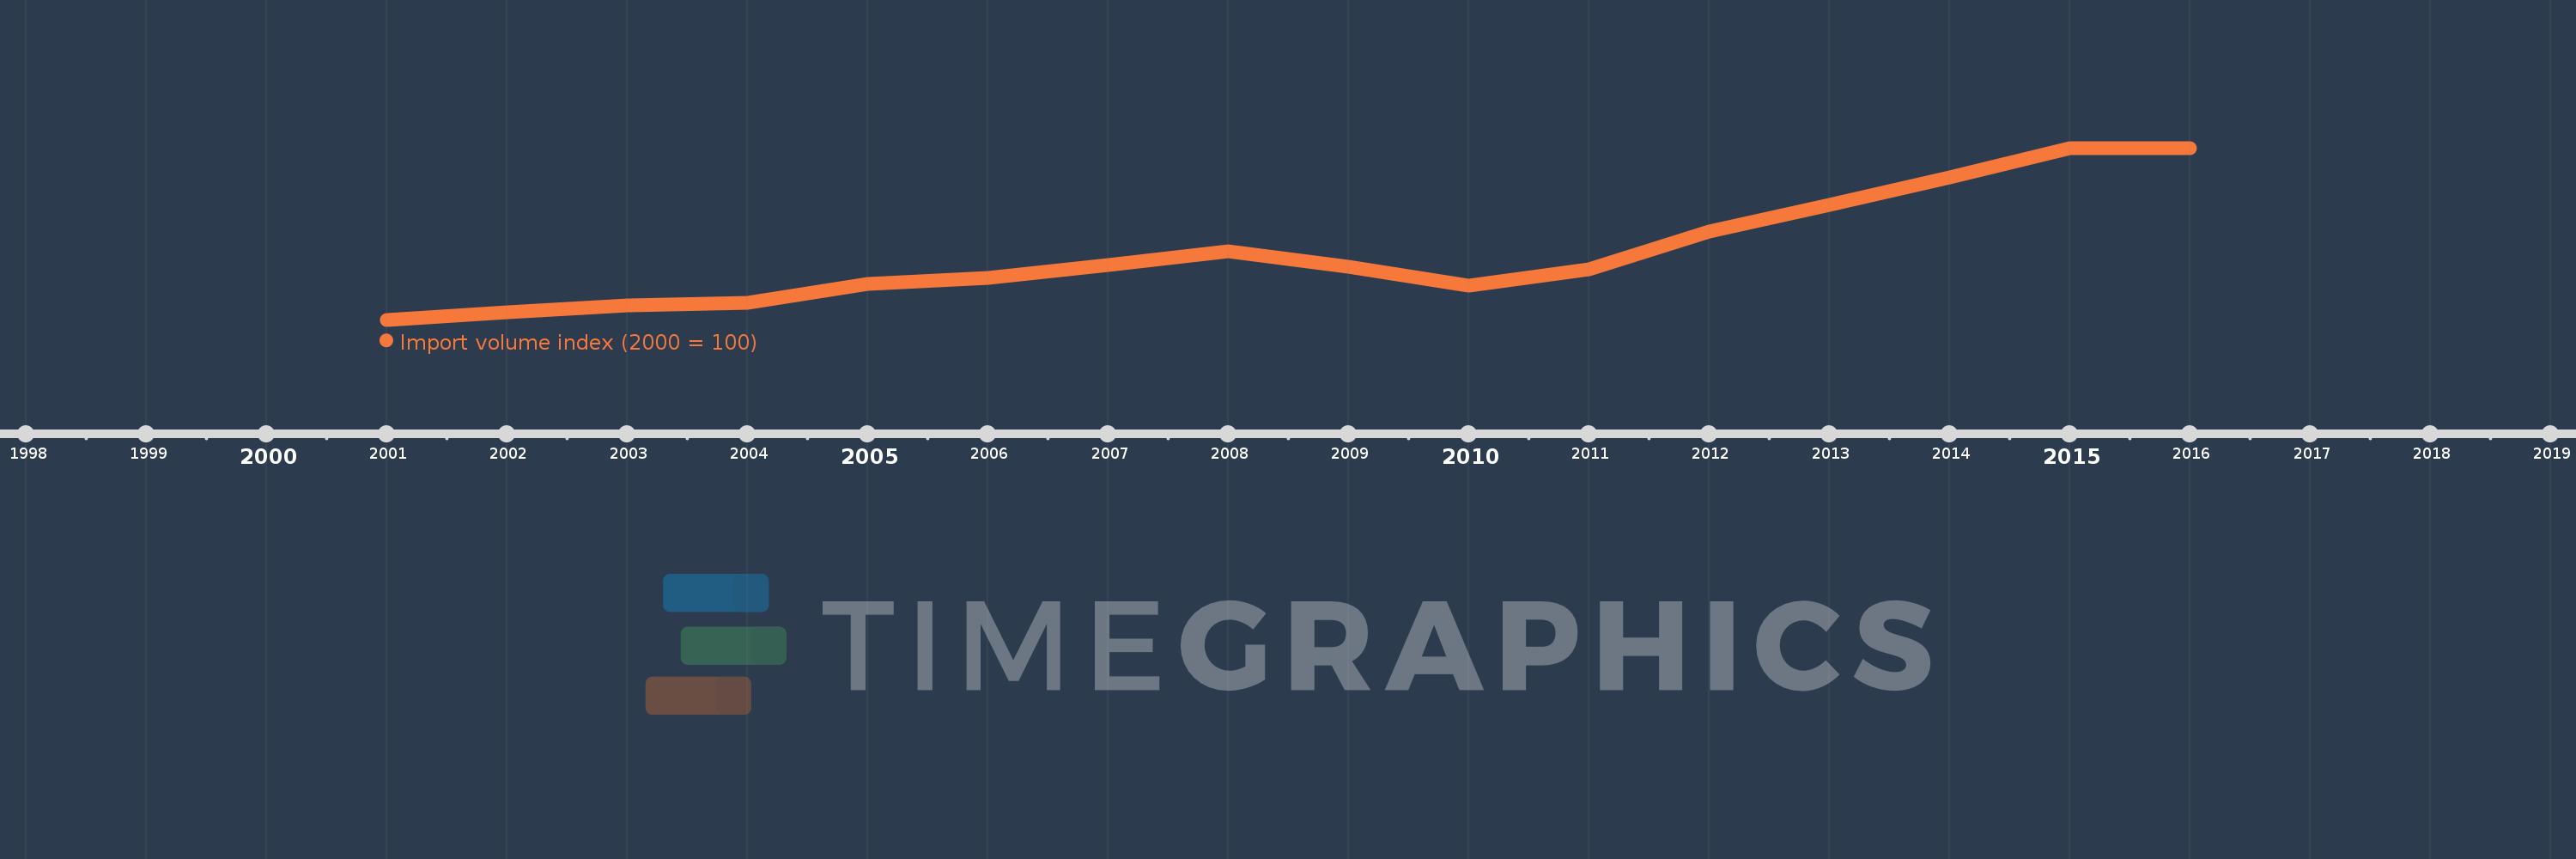
This timeline shows a graph from 2001 to 2016 of Macao SAR, China. No data until 2000. Number of actual observations by date: 16.
Source name:
World Development Indicators
Source organization:
United Nations Conference on Trade and Development, Handbook of Statistics and data files, and International Monetary Fund, International Financial Statistics.
Categories, topics:
Private Sector, Trade
Last updated:
apr 23, 2017
Indicators value changes by year
Meaning:
188.391
Minimum:
100.0
jan 1, 2001
Maximum:
328.182
jan 1, 2015
At the date of observation
Value
Absolute change
Change from the previous value
jan 1, 2001
100.0
+100.0
0.0%
jan 1, 2002
110.351
+10.351
10.35%
jan 1, 2003
119.314
+8.963
8.12%
jan 1, 2004
121.927
+2.613
2.19%
jan 1, 2005
147.067
+25.14
20.62%
jan 1, 2006
155.353
+8.287
5.63%
jan 1, 2007
173.168
+17.815
11.47%
jan 1, 2008
190.519
+17.351
10.02%
jan 1, 2009
169.995
-20.525
-10.77%
jan 1, 2010
145.736
-24.259
-14.27%
jan 1, 2011
166.917
+21.181
14.53%
jan 1, 2012
216.89
+49.974
29.94%
jan 1, 2013
252.667
+35.777
16.5%
jan 1, 2014
288.833
+36.166
14.31%
jan 1, 2015
328.182
+39.349
13.62%
jan 1, 2016
327.329
-0.853
-0.26%
Ranking of countries by current statistics by years