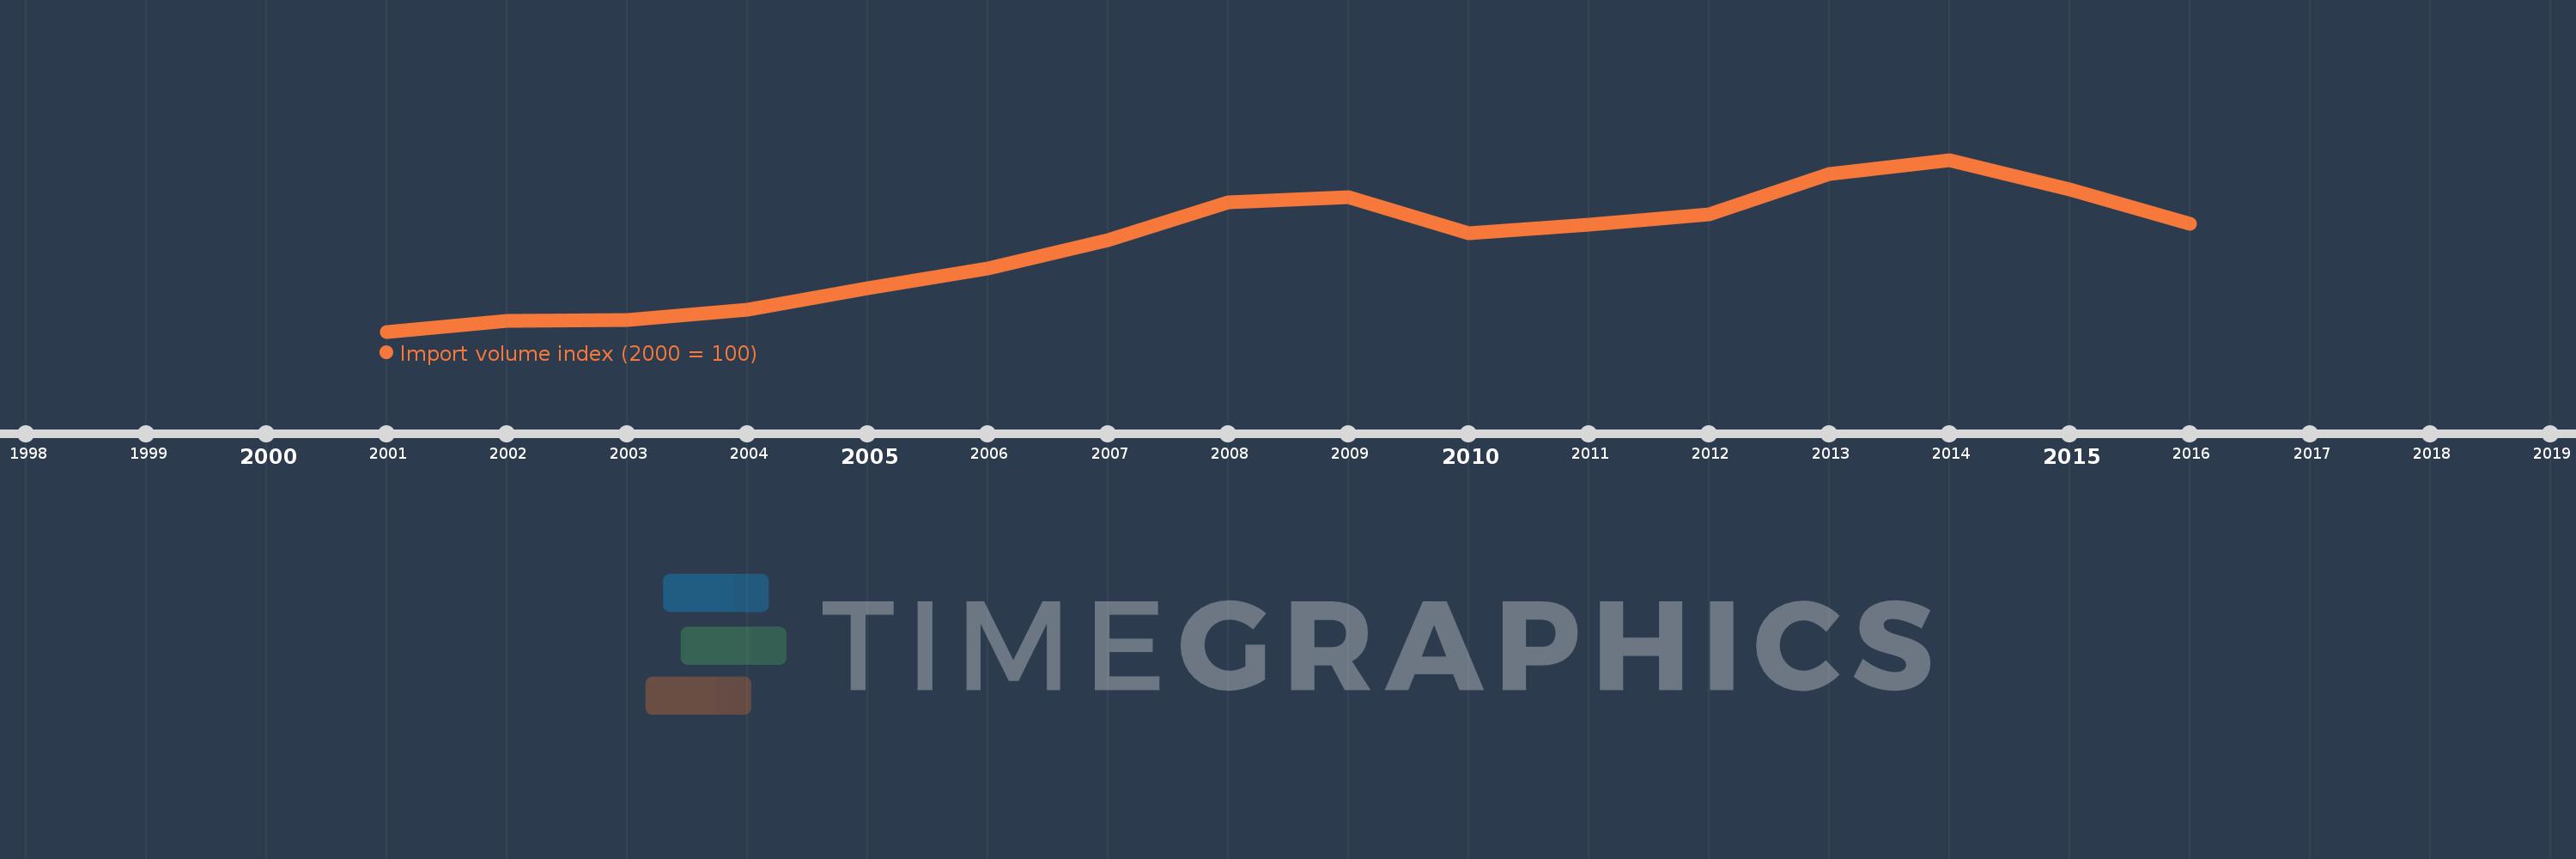
This timeline shows a graph from 2001 to 2016 of Kazakhstan. No data until 2000. Number of actual observations by date: 16.
Source name:
World Development Indicators
Source organization:
United Nations Conference on Trade and Development, Handbook of Statistics and data files, and International Monetary Fund, International Financial Statistics.
Categories, topics:
Private Sector, Trade
Last updated:
apr 23, 2017
Indicators value changes by year
Meaning:
349.395
Minimum:
100.0
jan 1, 2001
Maximum:
586.932
jan 1, 2014
At the date of observation
Value
Absolute change
Change from the previous value
jan 1, 2001
100.0
+100.0
0.0%
jan 1, 2002
130.225
+30.225
30.22%
jan 1, 2003
133.964
+3.739
2.87%
jan 1, 2004
161.172
+27.208
20.31%
jan 1, 2005
222.99
+61.818
38.36%
jan 1, 2006
279.679
+56.689
25.42%
jan 1, 2007
360.357
+80.678
28.85%
jan 1, 2008
465.468
+105.111
29.17%
jan 1, 2009
481.726
+16.258
3.49%
jan 1, 2010
377.811
-103.915
-21.57%
jan 1, 2011
402.559
+24.748
6.55%
jan 1, 2012
432.798
+30.239
7.51%
jan 1, 2013
547.781
+114.983
26.57%
jan 1, 2014
586.932
+39.15
7.15%
jan 1, 2015
501.866
-85.066
-14.49%
jan 1, 2016
404.986
-96.879
-19.3%
Ranking of countries by current statistics by years