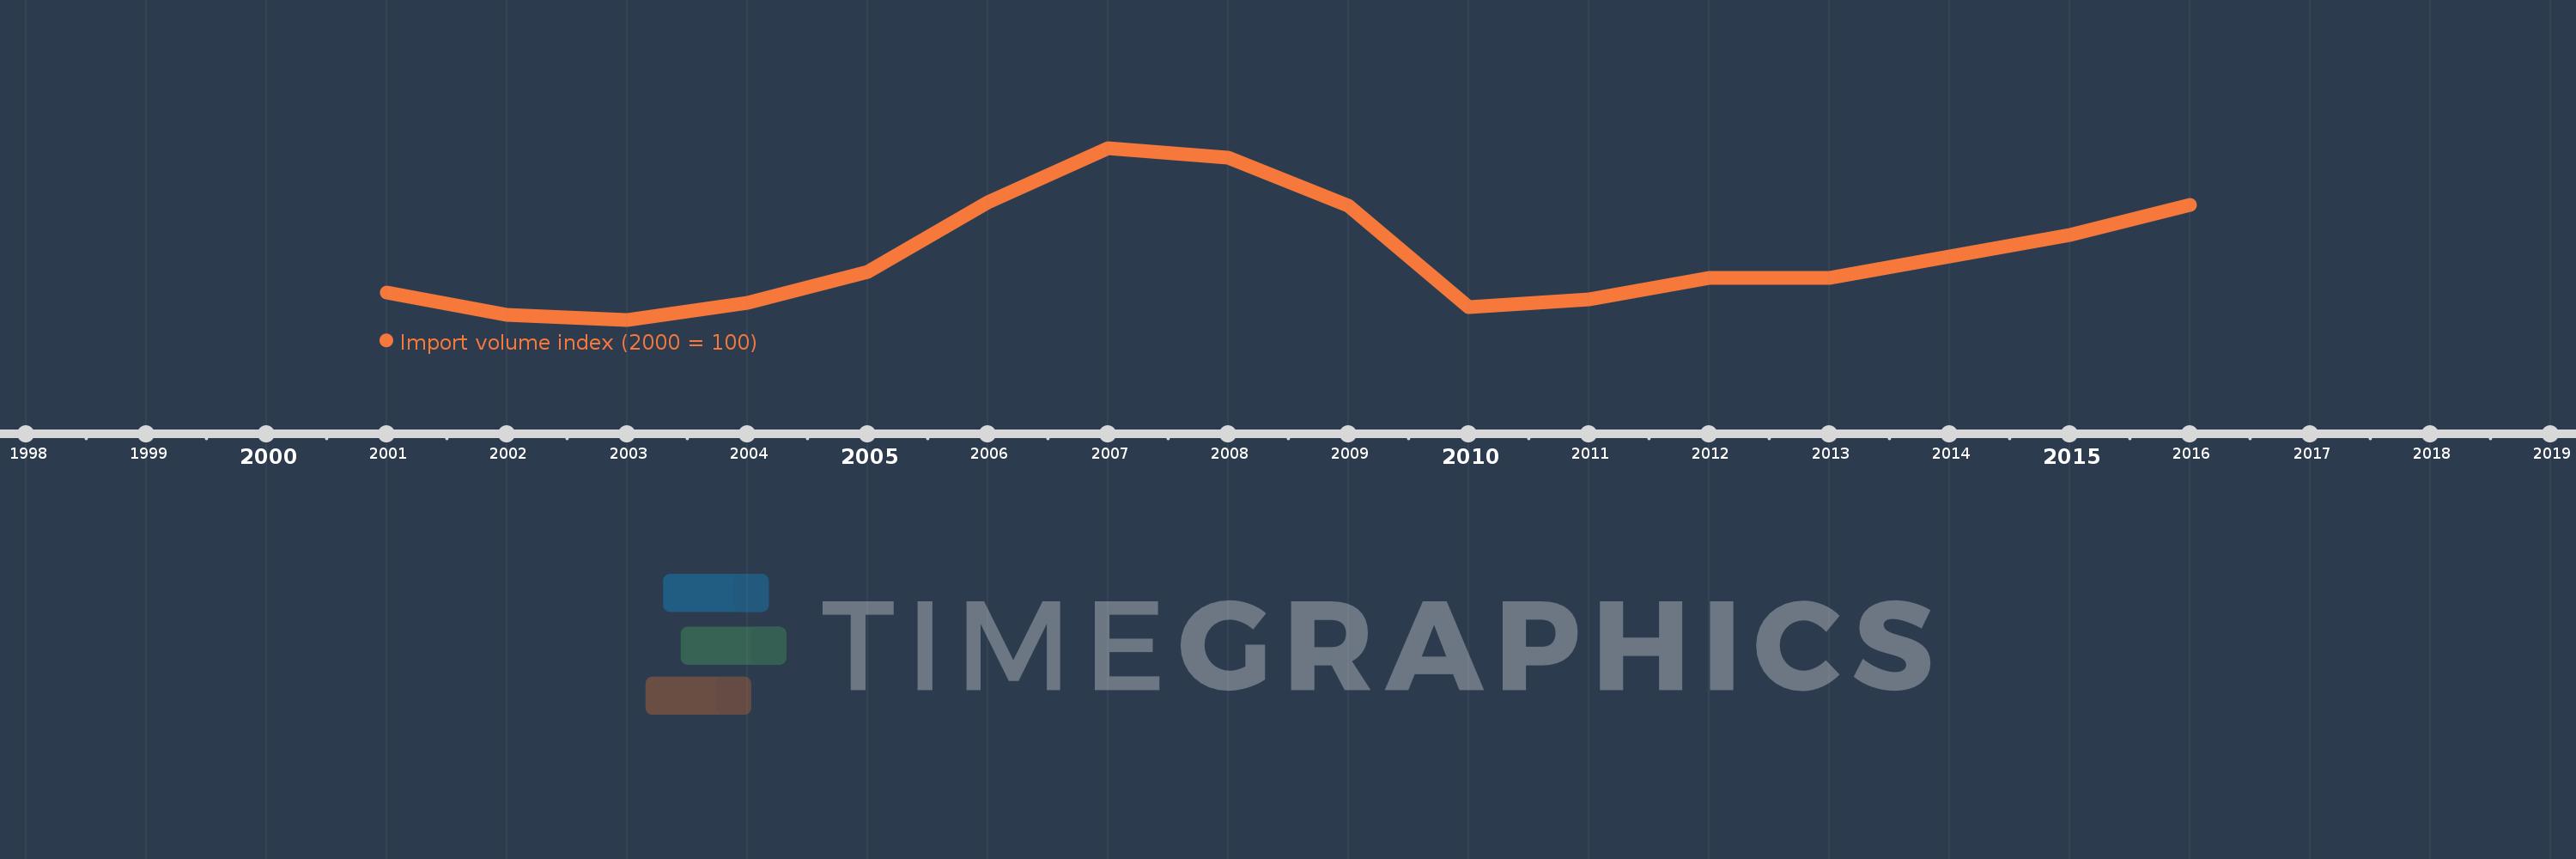
This timeline shows a graph from 2001 to 2016 of Iceland. No data until 2000. Number of actual observations by date: 16.
Source name:
World Development Indicators
Source organization:
United Nations Conference on Trade and Development, Handbook of Statistics and data files, and International Monetary Fund, International Financial Statistics.
Categories, topics:
Private Sector, Trade
Last updated:
apr 23, 2017
Indicators value changes by year
Meaning:
116.087
Minimum:
88.503
jan 1, 2003
Maximum:
161.403
jan 1, 2007
At the date of observation
Value
Absolute change
Change from the previous value
jan 1, 2001
100.0
+100.0
0.0%
jan 1, 2002
90.541
-9.459
-9.46%
jan 1, 2003
88.503
-2.039
-2.25%
jan 1, 2004
95.683
+7.18
8.11%
jan 1, 2005
108.695
+13.013
13.6%
jan 1, 2006
138.368
+29.673
27.3%
jan 1, 2007
161.403
+23.035
16.65%
jan 1, 2008
157.426
-3.977
-2.46%
jan 1, 2009
136.793
-20.633
-13.11%
jan 1, 2010
93.875
-42.918
-31.37%
jan 1, 2011
97.073
+3.198
3.41%
jan 1, 2012
106.085
+9.012
9.28%
jan 1, 2013
106.151
+0.066
0.06%
jan 1, 2014
115.296
+9.145
8.61%
jan 1, 2015
124.409
+9.113
7.9%
jan 1, 2016
137.087
+12.678
10.19%
Ranking of countries by current statistics by years