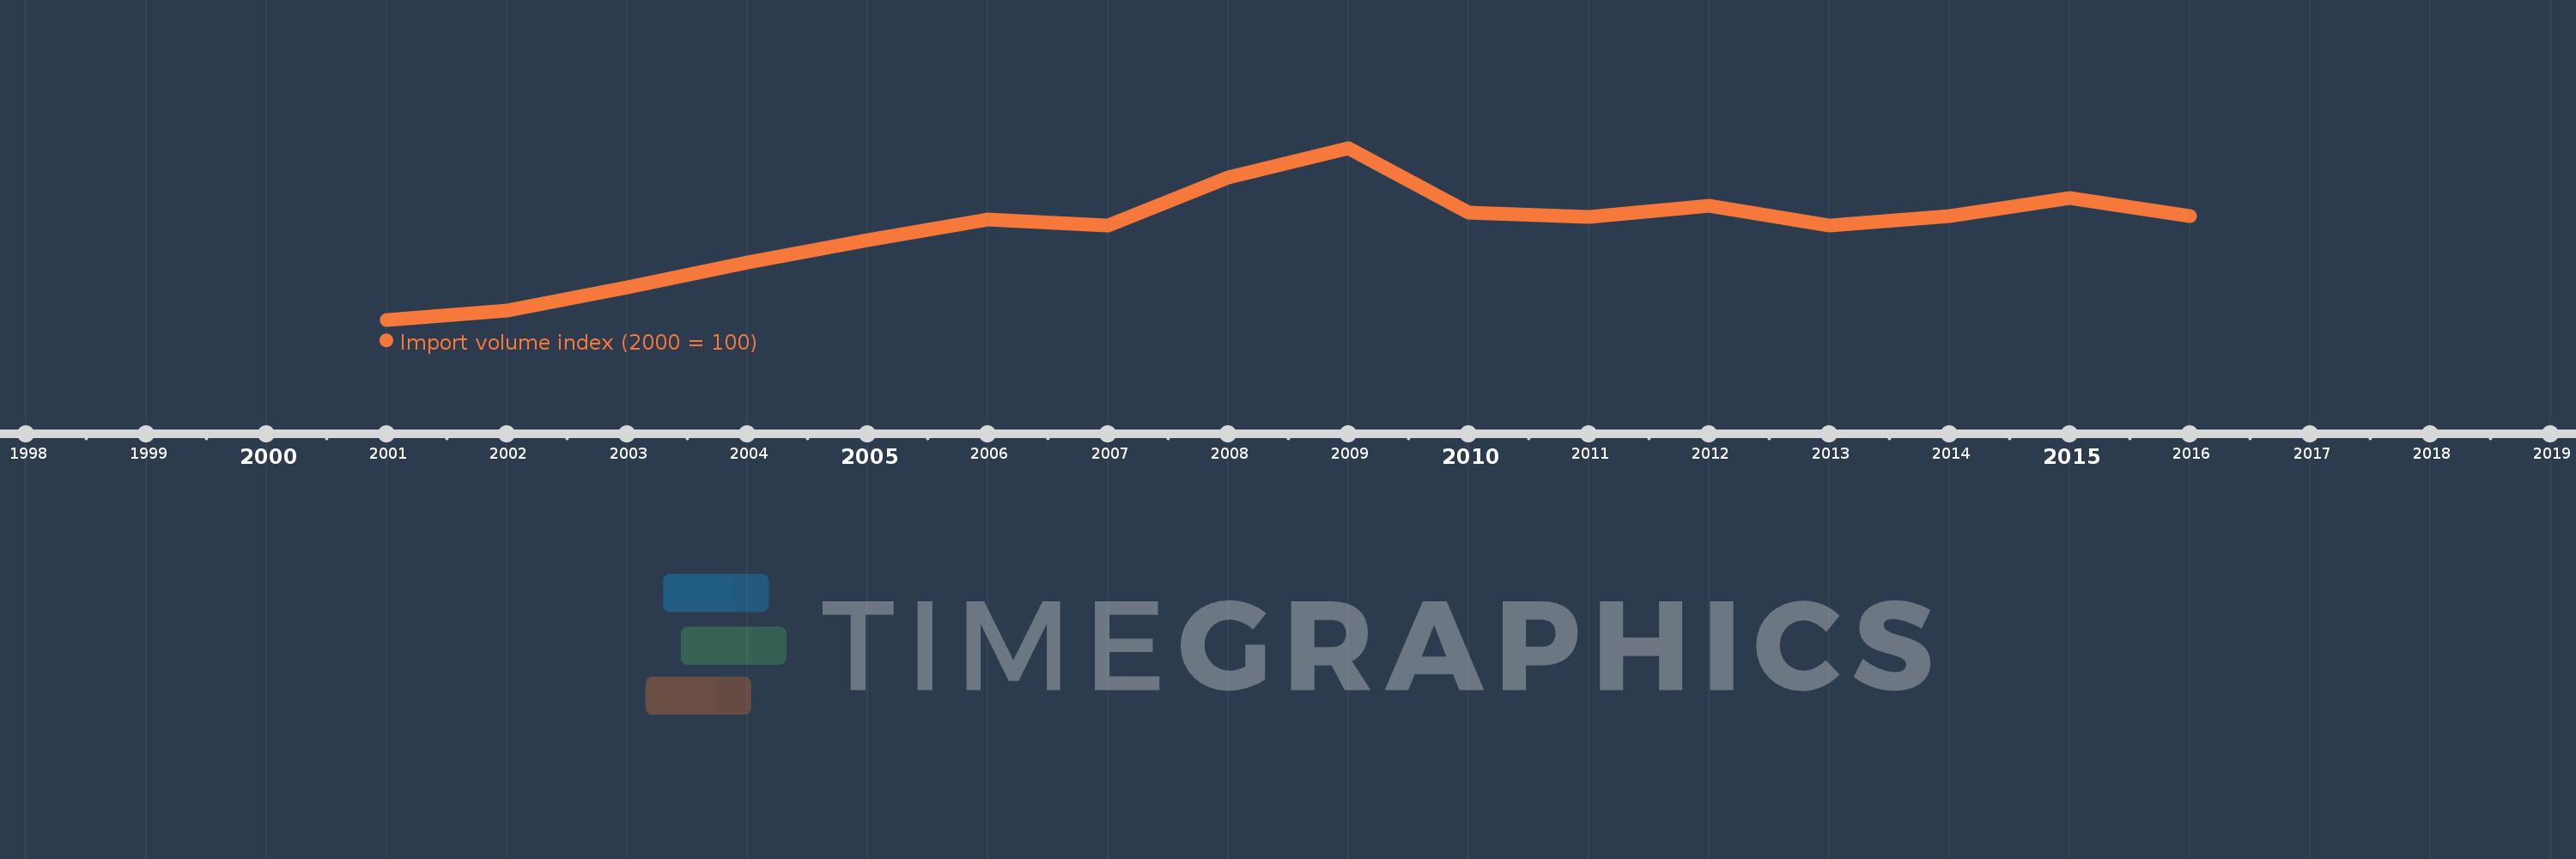
This timeline shows a graph from 2001 to 2016 of Bosnia and Herzegovina. No data until 2000. Number of actual observations by date: 16.
Source name:
World Development Indicators
Source organization:
United Nations Conference on Trade and Development, Handbook of Statistics and data files, and International Monetary Fund, International Financial Statistics.
Categories, topics:
Private Sector, Trade
Last updated:
apr 23, 2017
Indicators value changes by year
Meaning:
169.747
Minimum:
100.0
jan 1, 2001
Maximum:
233.741
jan 1, 2009
At the date of observation
Value
Absolute change
Change from the previous value
jan 1, 2001
100.0
+100.0
0.0%
jan 1, 2002
106.898
+6.898
6.9%
jan 1, 2003
125.168
+18.269
17.09%
jan 1, 2004
144.332
+19.164
15.31%
jan 1, 2005
161.869
+17.537
12.15%
jan 1, 2006
178.289
+16.42
10.14%
jan 1, 2007
173.241
-5.048
-2.83%
jan 1, 2008
210.634
+37.393
21.58%
jan 1, 2009
233.741
+23.107
10.97%
jan 1, 2010
183.531
-50.21
-21.48%
jan 1, 2011
180.164
-3.367
-1.83%
jan 1, 2012
188.47
+8.306
4.61%
jan 1, 2013
173.282
-15.187
-8.06%
jan 1, 2014
180.857
+7.574
4.37%
jan 1, 2015
194.75
+13.894
7.68%
jan 1, 2016
180.723
-14.027
-7.2%
Ranking of countries by current statistics by years