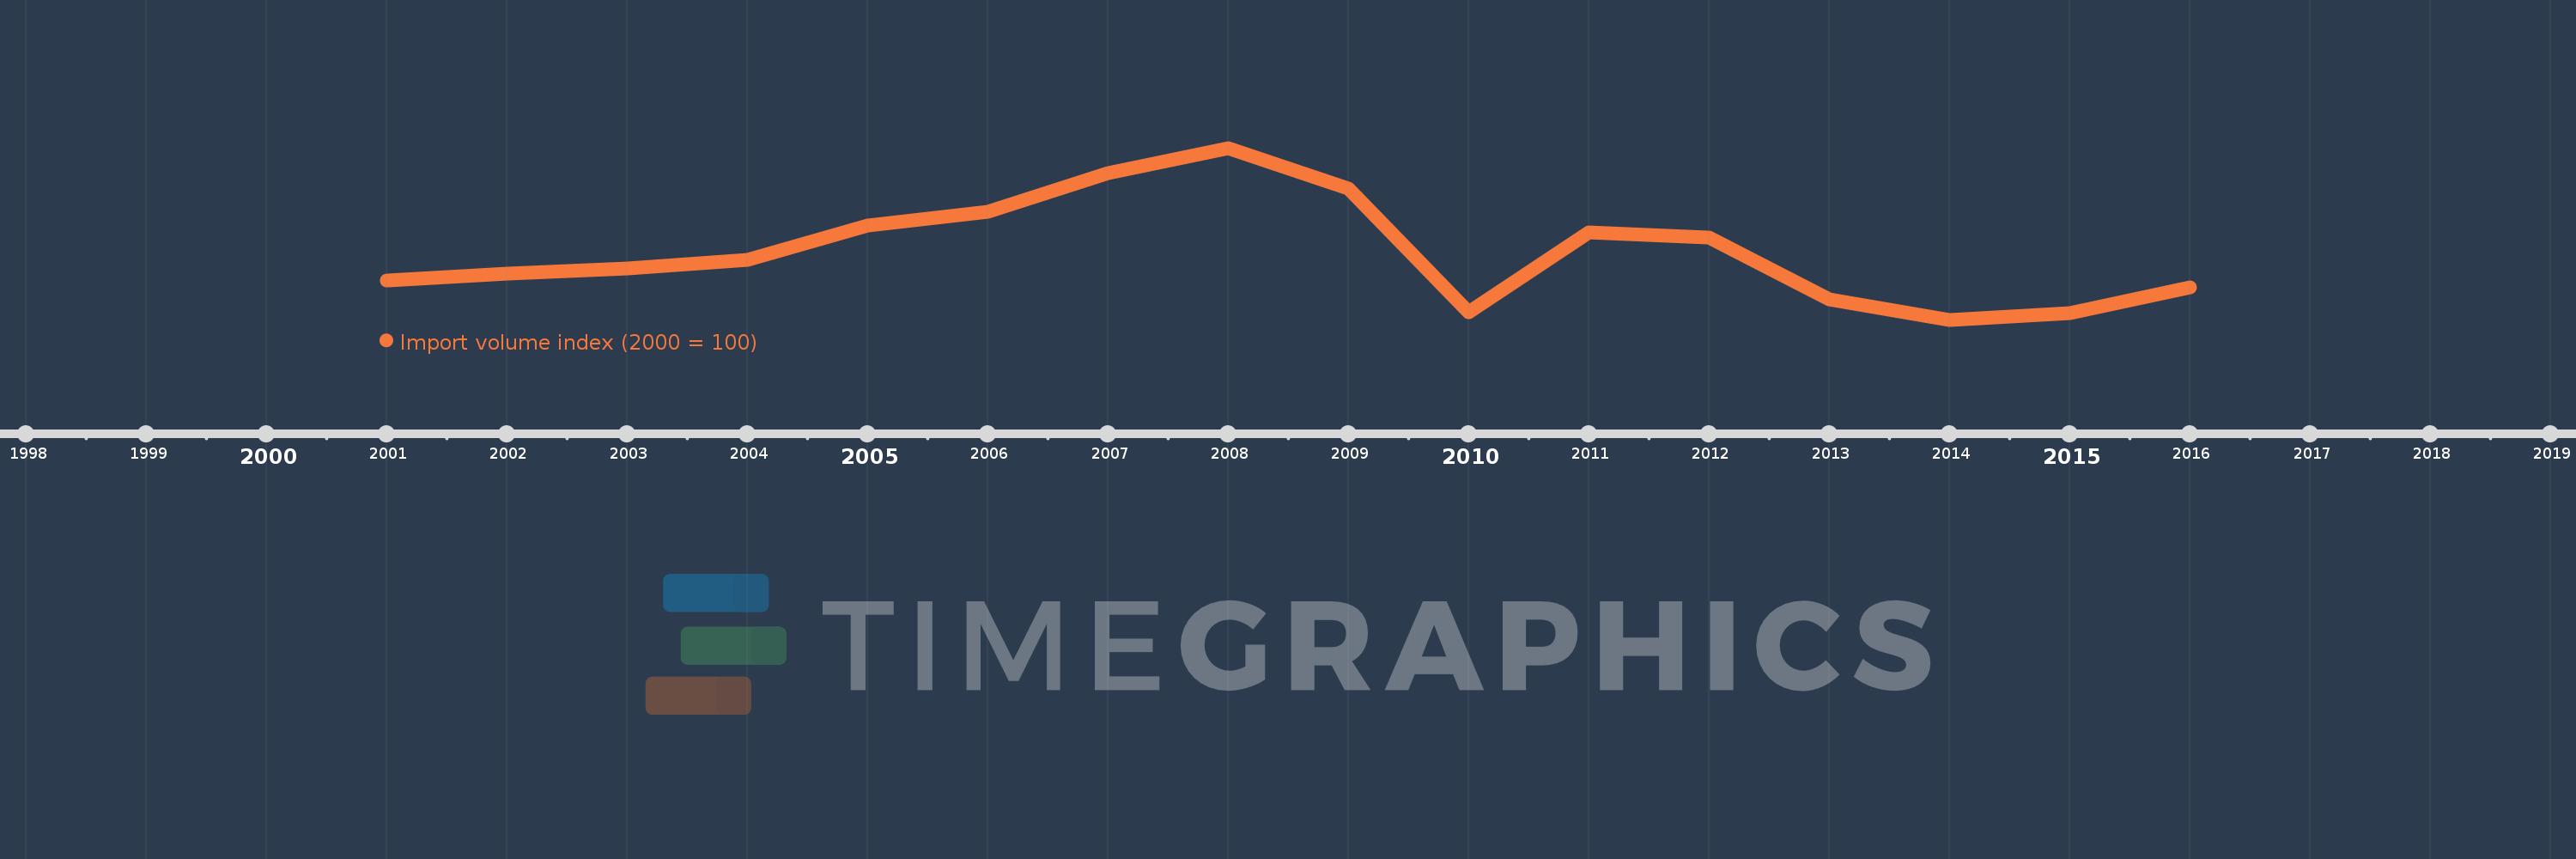
This timeline shows a graph from 2001 to 2016 of Italy. No data until 2000. Number of actual observations by date: 16.
Source name:
World Development Indicators
Source organization:
United Nations Conference on Trade and Development, Handbook of Statistics and data files, and International Monetary Fund, International Financial Statistics.
Categories, topics:
Private Sector, Trade
Last updated:
apr 23, 2017
Indicators value changes by year
Meaning:
104.257
Minimum:
94.099
jan 1, 2014
Maximum:
119.818
jan 1, 2008
At the date of observation
Value
Absolute change
Change from the previous value
jan 1, 2001
100.0
+100.0
0.0%
jan 1, 2002
101.061
+1.061
1.06%
jan 1, 2003
101.82
+0.759
0.75%
jan 1, 2004
103.089
+1.268
1.25%
jan 1, 2005
108.268
+5.179
5.02%
jan 1, 2006
110.203
+1.935
1.79%
jan 1, 2007
116.003
+5.8
5.26%
jan 1, 2008
119.818
+3.815
3.29%
jan 1, 2009
113.694
-6.125
-5.11%
jan 1, 2010
95.247
-18.447
-16.22%
jan 1, 2011
107.139
+11.892
12.49%
jan 1, 2012
106.463
-0.676
-0.63%
jan 1, 2013
97.099
-9.364
-8.8%
jan 1, 2014
94.099
-2.999
-3.09%
jan 1, 2015
95.095
+0.996
1.06%
jan 1, 2016
99.007
+3.912
4.11%
Ranking of countries by current statistics by years