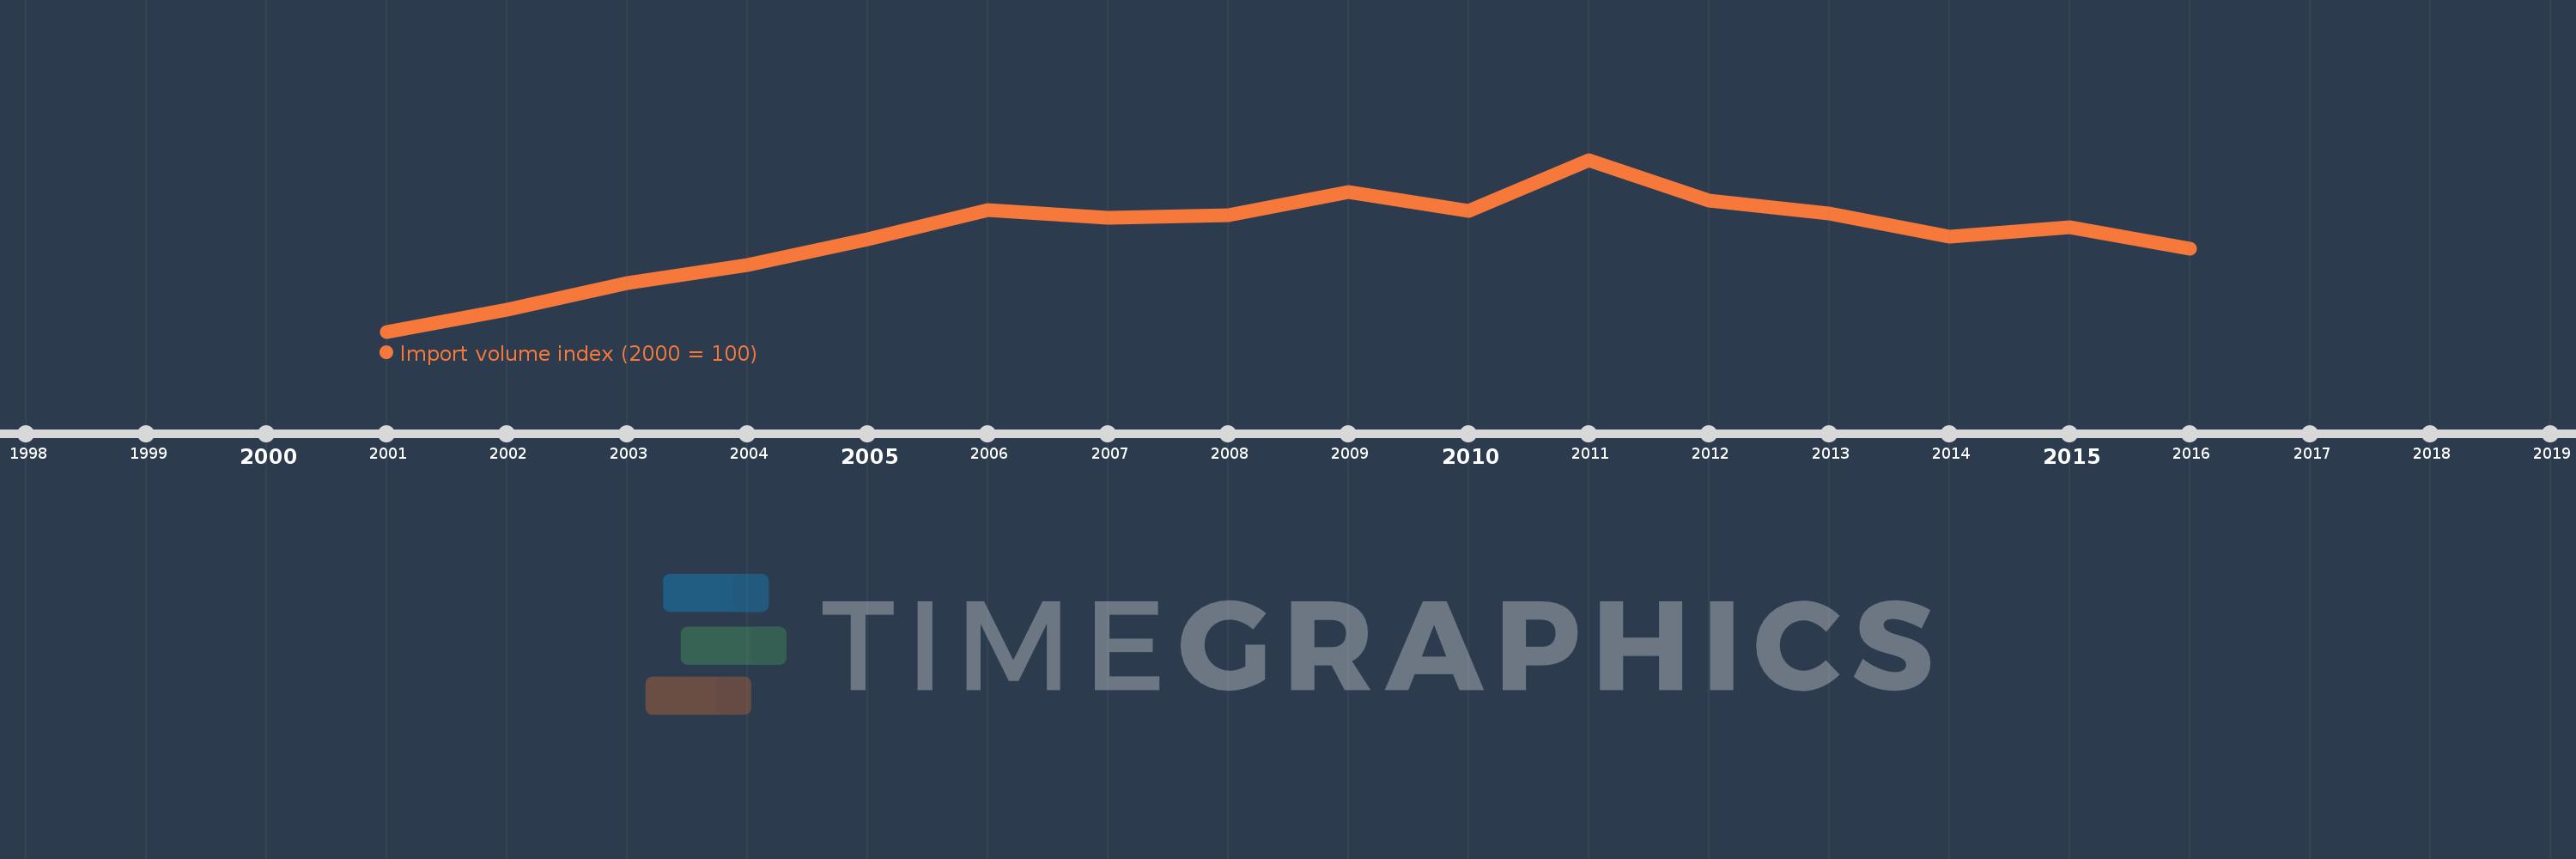
This timeline shows a graph from 2001 to 2016 of Iran, Islamic Rep.. No data until 2000. Number of actual observations by date: 16.
Source name:
World Development Indicators
Source organization:
United Nations Conference on Trade and Development, Handbook of Statistics and data files, and International Monetary Fund, International Financial Statistics.
Categories, topics:
Private Sector, Trade
Last updated:
apr 23, 2017
Indicators value changes by year
Meaning:
199.749
Minimum:
100.0
jan 1, 2001
Maximum:
277.552
jan 1, 2011
At the date of observation
Value
Absolute change
Change from the previous value
jan 1, 2001
100.0
+100.0
0.0%
jan 1, 2002
123.029
+23.029
23.03%
jan 1, 2003
150.033
+27.004
21.95%
jan 1, 2004
168.487
+18.454
12.3%
jan 1, 2005
195.062
+26.575
15.77%
jan 1, 2006
225.914
+30.852
15.82%
jan 1, 2007
217.847
-8.066
-3.57%
jan 1, 2008
220.657
+2.809
1.29%
jan 1, 2009
244.348
+23.691
10.74%
jan 1, 2010
224.373
-19.974
-8.17%
jan 1, 2011
277.552
+53.178
23.7%
jan 1, 2012
235.737
-41.814
-15.07%
jan 1, 2013
221.625
-14.113
-5.99%
jan 1, 2014
197.95
-23.675
-10.68%
jan 1, 2015
207.556
+9.607
4.85%
jan 1, 2016
185.814
-21.742
-10.48%
Ranking of countries by current statistics by years