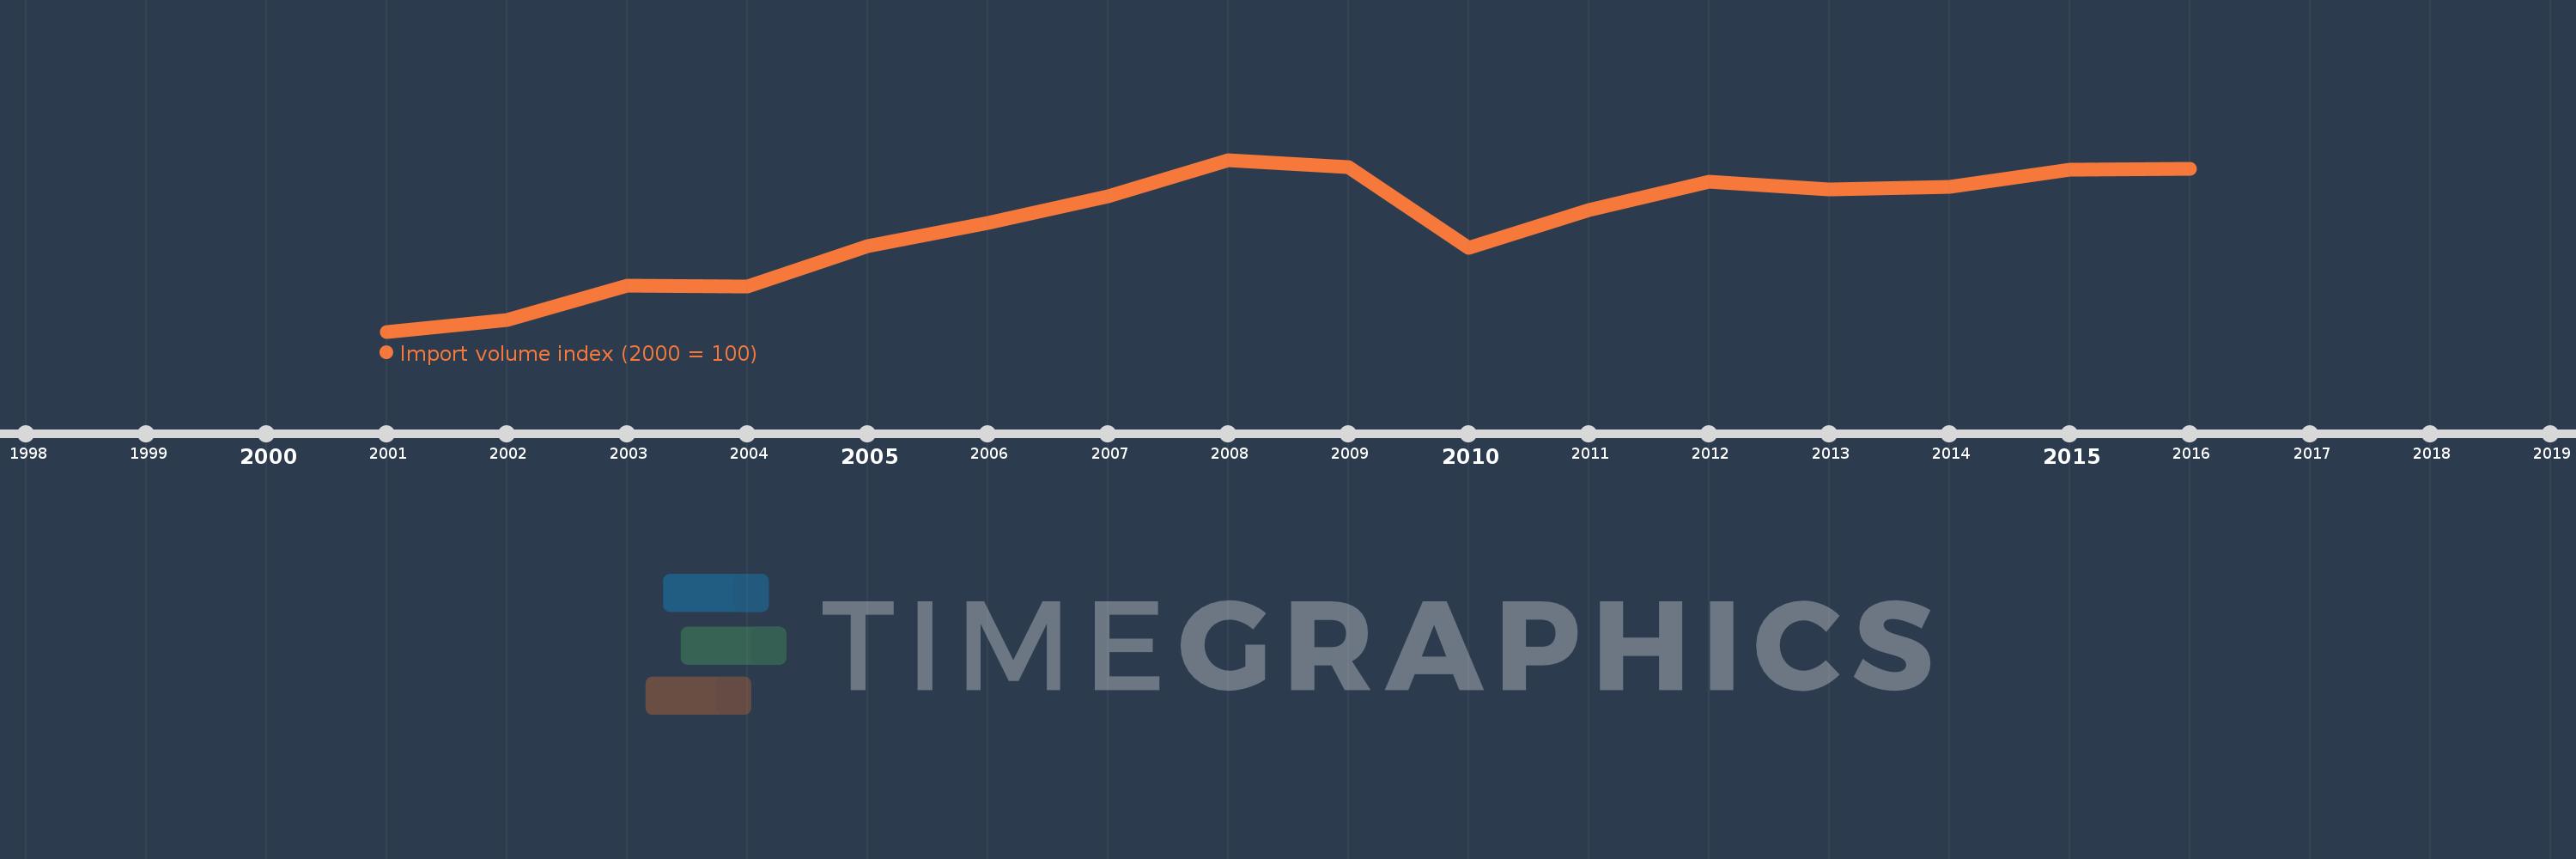
This timeline shows a graph from 2001 to 2016 of Belgium. No data until 2000. Number of actual observations by date: 16.
Source name:
World Development Indicators
Source organization:
United Nations Conference on Trade and Development, Handbook of Statistics and data files, and International Monetary Fund, International Financial Statistics.
Categories, topics:
Private Sector, Trade
Last updated:
apr 23, 2017
Indicators value changes by year
Meaning:
123.016
Minimum:
100.0
jan 1, 2001
Maximum:
136.44
jan 1, 2008
At the date of observation
Value
Absolute change
Change from the previous value
jan 1, 2001
100.0
+100.0
0.0%
jan 1, 2002
102.382
+2.382
2.38%
jan 1, 2003
109.771
+7.389
7.22%
jan 1, 2004
109.652
-0.119
-0.11%
jan 1, 2005
118.097
+8.445
7.7%
jan 1, 2006
123.106
+5.009
4.24%
jan 1, 2007
128.694
+5.588
4.54%
jan 1, 2008
136.44
+7.746
6.02%
jan 1, 2009
134.947
-1.493
-1.09%
jan 1, 2010
117.675
-17.272
-12.8%
jan 1, 2011
125.706
+8.032
6.83%
jan 1, 2012
131.883
+6.177
4.91%
jan 1, 2013
130.225
-1.658
-1.26%
jan 1, 2014
130.791
+0.567
0.44%
jan 1, 2015
134.418
+3.627
2.77%
jan 1, 2016
134.464
+0.045
0.03%
Ranking of countries by current statistics by years