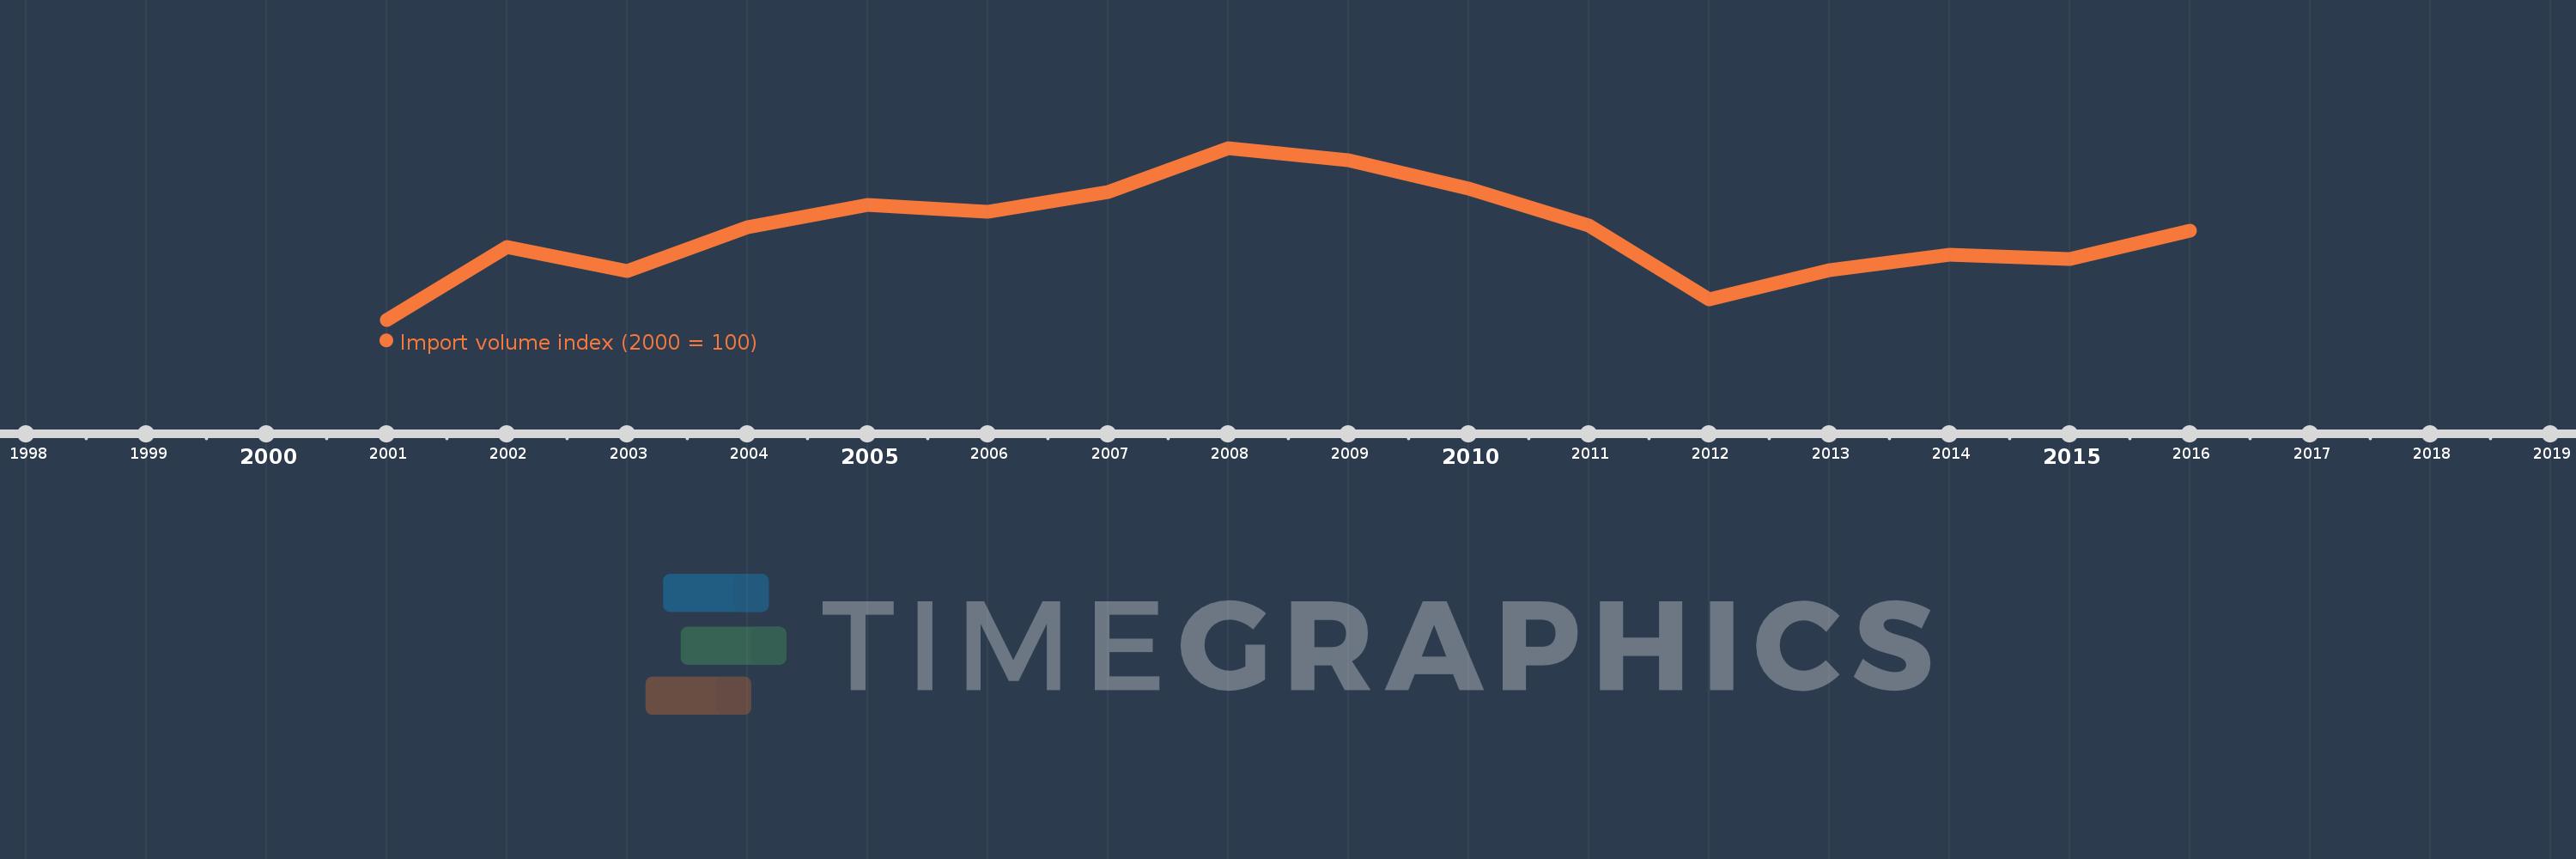
This timeline shows a graph from 2001 to 2016 of St. Vincent and the Grenadines. No data until 2000. Number of actual observations by date: 16.
Source name:
World Development Indicators
Source organization:
United Nations Conference on Trade and Development, Handbook of Statistics and data files, and International Monetary Fund, International Financial Statistics.
Categories, topics:
Private Sector, Trade
Last updated:
apr 23, 2017
Indicators value changes by year
Meaning:
124.207
Minimum:
100.0
jan 1, 2001
Maximum:
147.4
jan 1, 2008
At the date of observation
Value
Absolute change
Change from the previous value
jan 1, 2001
100.0
+100.0
0.0%
jan 1, 2002
119.966
+19.966
19.97%
jan 1, 2003
113.362
-6.604
-5.51%
jan 1, 2004
125.415
+12.053
10.63%
jan 1, 2005
131.702
+6.287
5.01%
jan 1, 2006
129.715
-1.987
-1.51%
jan 1, 2007
135.182
+5.466
4.21%
jan 1, 2008
147.4
+12.219
9.04%
jan 1, 2009
143.966
-3.434
-2.33%
jan 1, 2010
136.166
-7.8
-5.42%
jan 1, 2011
125.986
-10.181
-7.48%
jan 1, 2012
105.531
-20.454
-16.24%
jan 1, 2013
113.589
+8.058
7.64%
jan 1, 2014
118.028
+4.439
3.91%
jan 1, 2015
116.679
-1.349
-1.14%
jan 1, 2016
124.633
+7.955
6.82%
Ranking of countries by current statistics by years