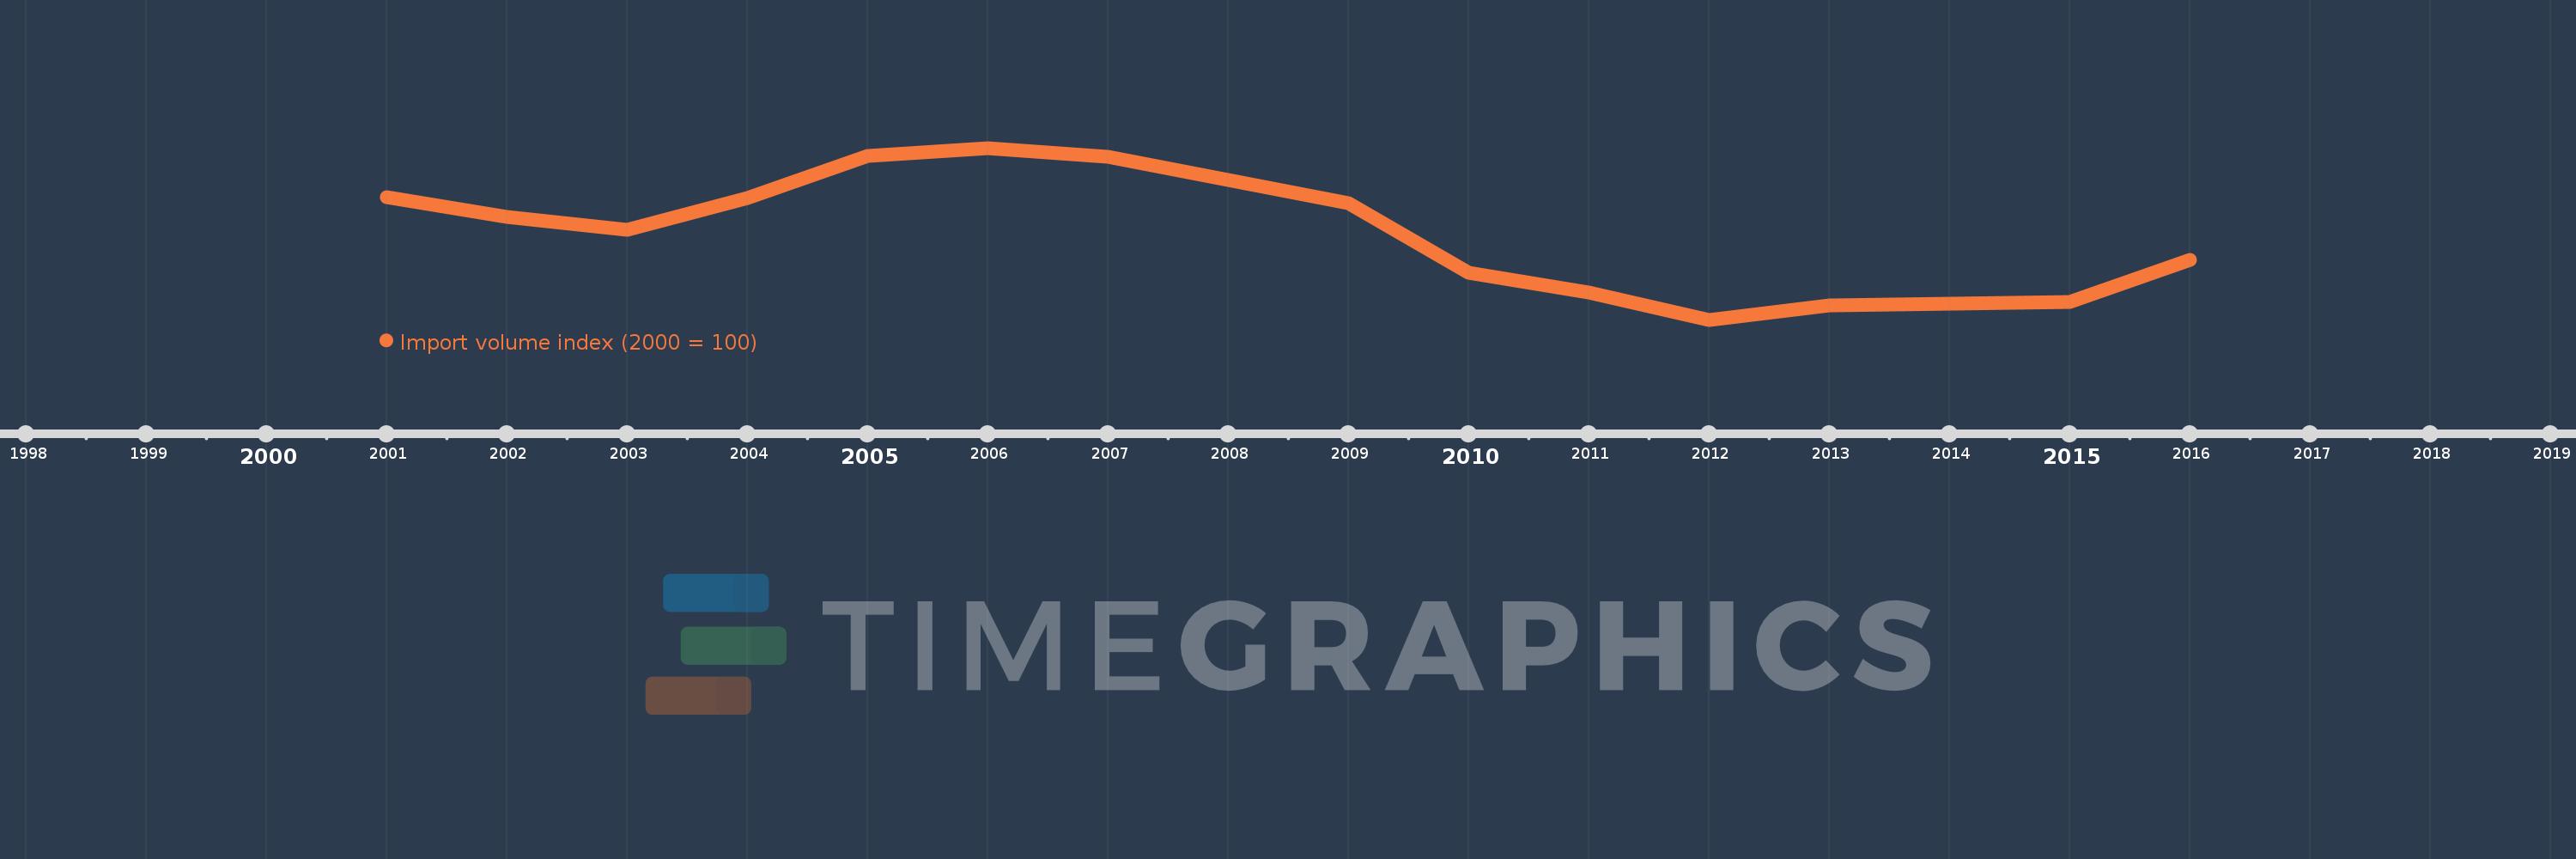
This timeline shows a graph from 2001 to 2016 of Barbados. No data until 2000. Number of actual observations by date: 16.
Source name:
World Development Indicators
Source organization:
United Nations Conference on Trade and Development, Handbook of Statistics and data files, and International Monetary Fund, International Financial Statistics.
Categories, topics:
Private Sector, Trade
Last updated:
apr 23, 2017
Indicators value changes by year
Meaning:
91.643
Minimum:
72.016
jan 1, 2012
Maximum:
111.232
jan 1, 2006
At the date of observation
Value
Absolute change
Change from the previous value
jan 1, 2001
100.0
+100.0
0.0%
jan 1, 2002
95.486
-4.514
-4.51%
jan 1, 2003
92.627
-2.86
-2.99%
jan 1, 2004
99.888
+7.261
7.84%
jan 1, 2005
109.339
+9.45
9.46%
jan 1, 2006
111.232
+1.894
1.73%
jan 1, 2007
109.306
-1.926
-1.73%
jan 1, 2008
103.889
-5.416
-4.96%
jan 1, 2009
98.691
-5.198
-5.0%
jan 1, 2010
82.654
-16.037
-16.25%
jan 1, 2011
78.281
-4.373
-5.29%
jan 1, 2012
72.016
-6.266
-8.0%
jan 1, 2013
75.333
+3.318
4.61%
jan 1, 2014
75.727
+0.393
0.52%
jan 1, 2015
76.127
+0.4
0.53%
jan 1, 2016
85.689
+9.562
12.56%
Ranking of countries by current statistics by years