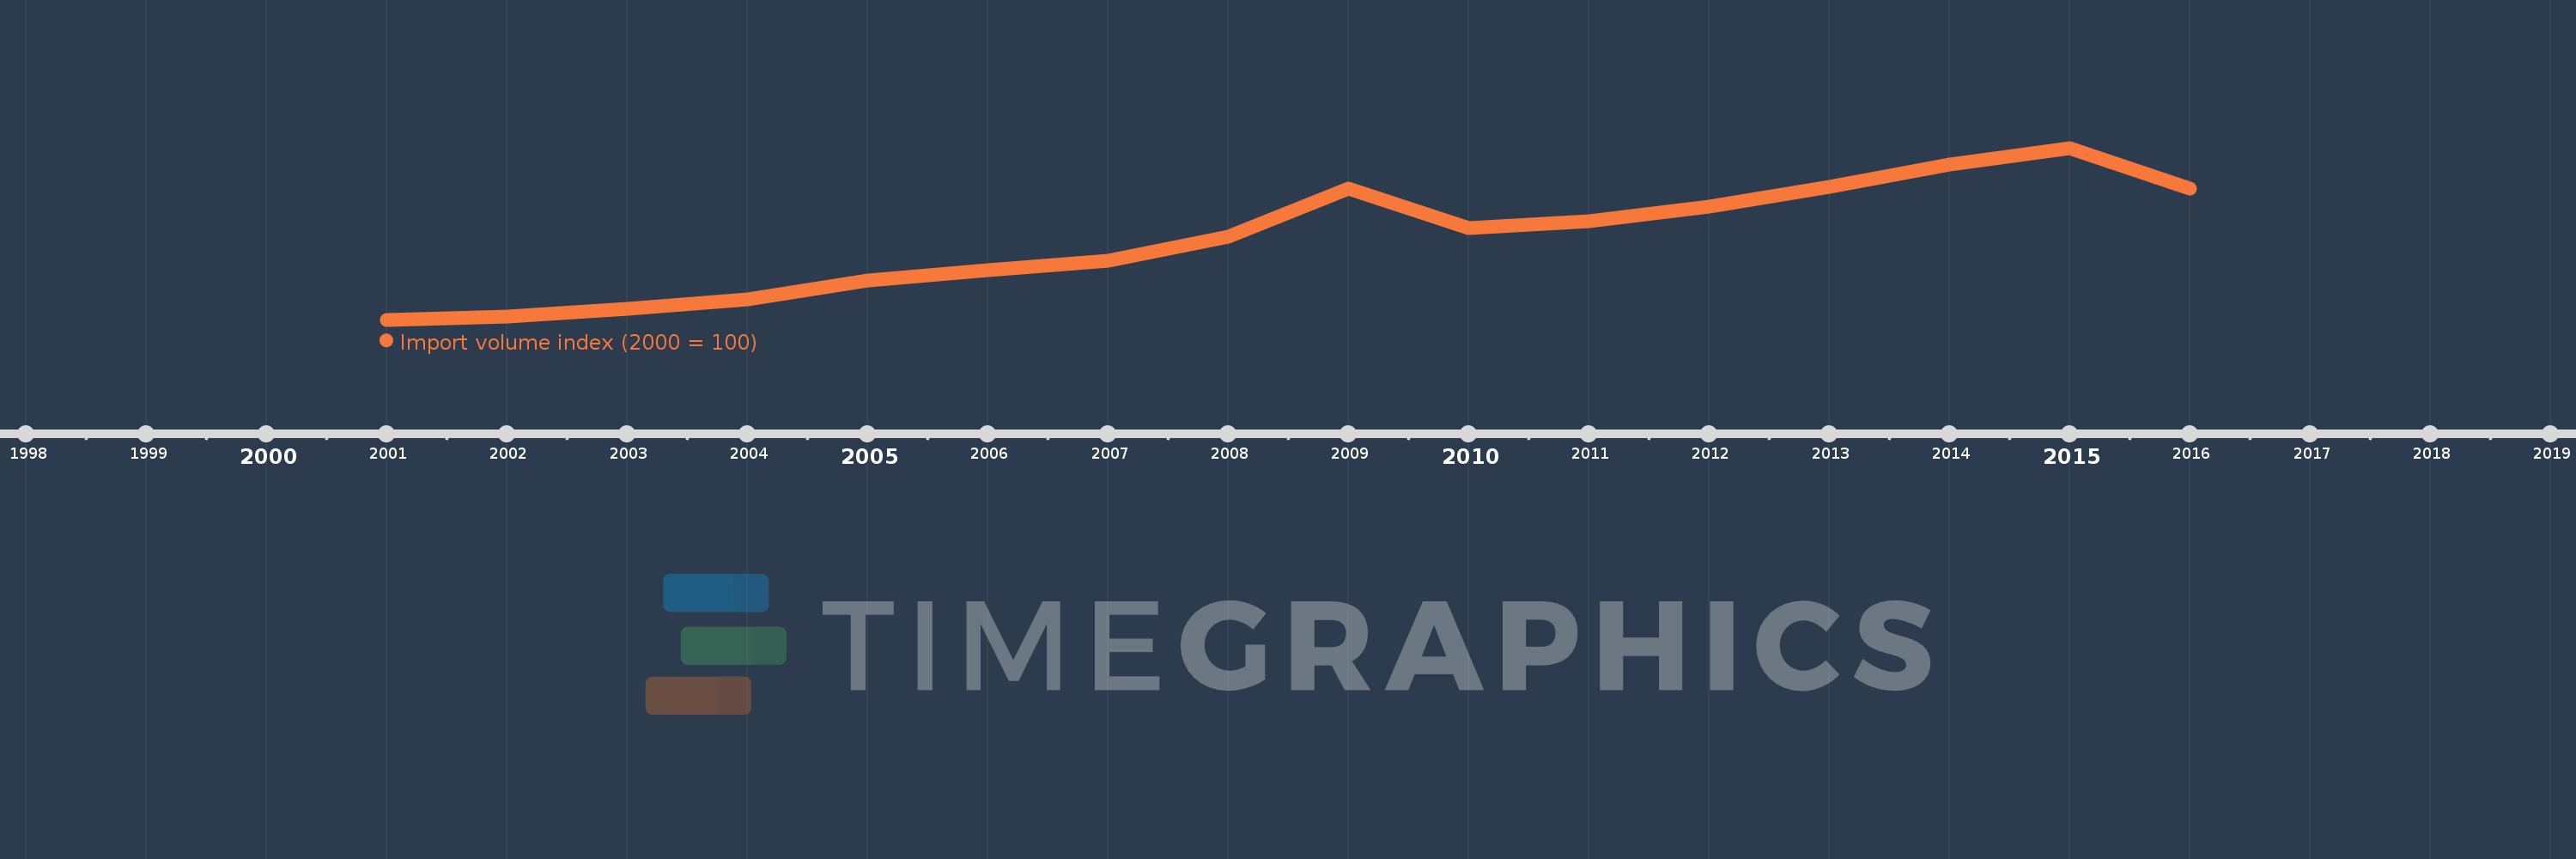
This timeline shows a graph from 2001 to 2016 of United Arab Emirates. No data until 2000. Number of actual observations by date: 16.
Source name:
World Development Indicators
Source organization:
United Nations Conference on Trade and Development, Handbook of Statistics and data files, and International Monetary Fund, International Financial Statistics.
Categories, topics:
Private Sector, Trade
Last updated:
apr 23, 2017
Indicators value changes by year
Meaning:
288.284
Minimum:
100.0
jan 1, 2001
Maximum:
500.685
jan 1, 2015
At the date of observation
Value
Absolute change
Change from the previous value
jan 1, 2001
100.0
+100.0
0.0%
jan 1, 2002
108.312
+8.312
8.31%
jan 1, 2003
124.828
+16.516
15.25%
jan 1, 2004
147.154
+22.326
17.89%
jan 1, 2005
191.15
+43.996
29.9%
jan 1, 2006
215.371
+24.221
12.67%
jan 1, 2007
237.553
+22.182
10.3%
jan 1, 2008
294.565
+57.012
24.0%
jan 1, 2009
406.565
+112.0
38.02%
jan 1, 2010
314.485
-92.079
-22.65%
jan 1, 2011
330.594
+16.109
5.12%
jan 1, 2012
364.373
+33.778
10.22%
jan 1, 2013
409.868
+45.495
12.49%
jan 1, 2014
461.288
+51.42
12.55%
jan 1, 2015
500.685
+39.398
8.54%
jan 1, 2016
405.753
-94.932
-18.96%
Ranking of countries by current statistics by years