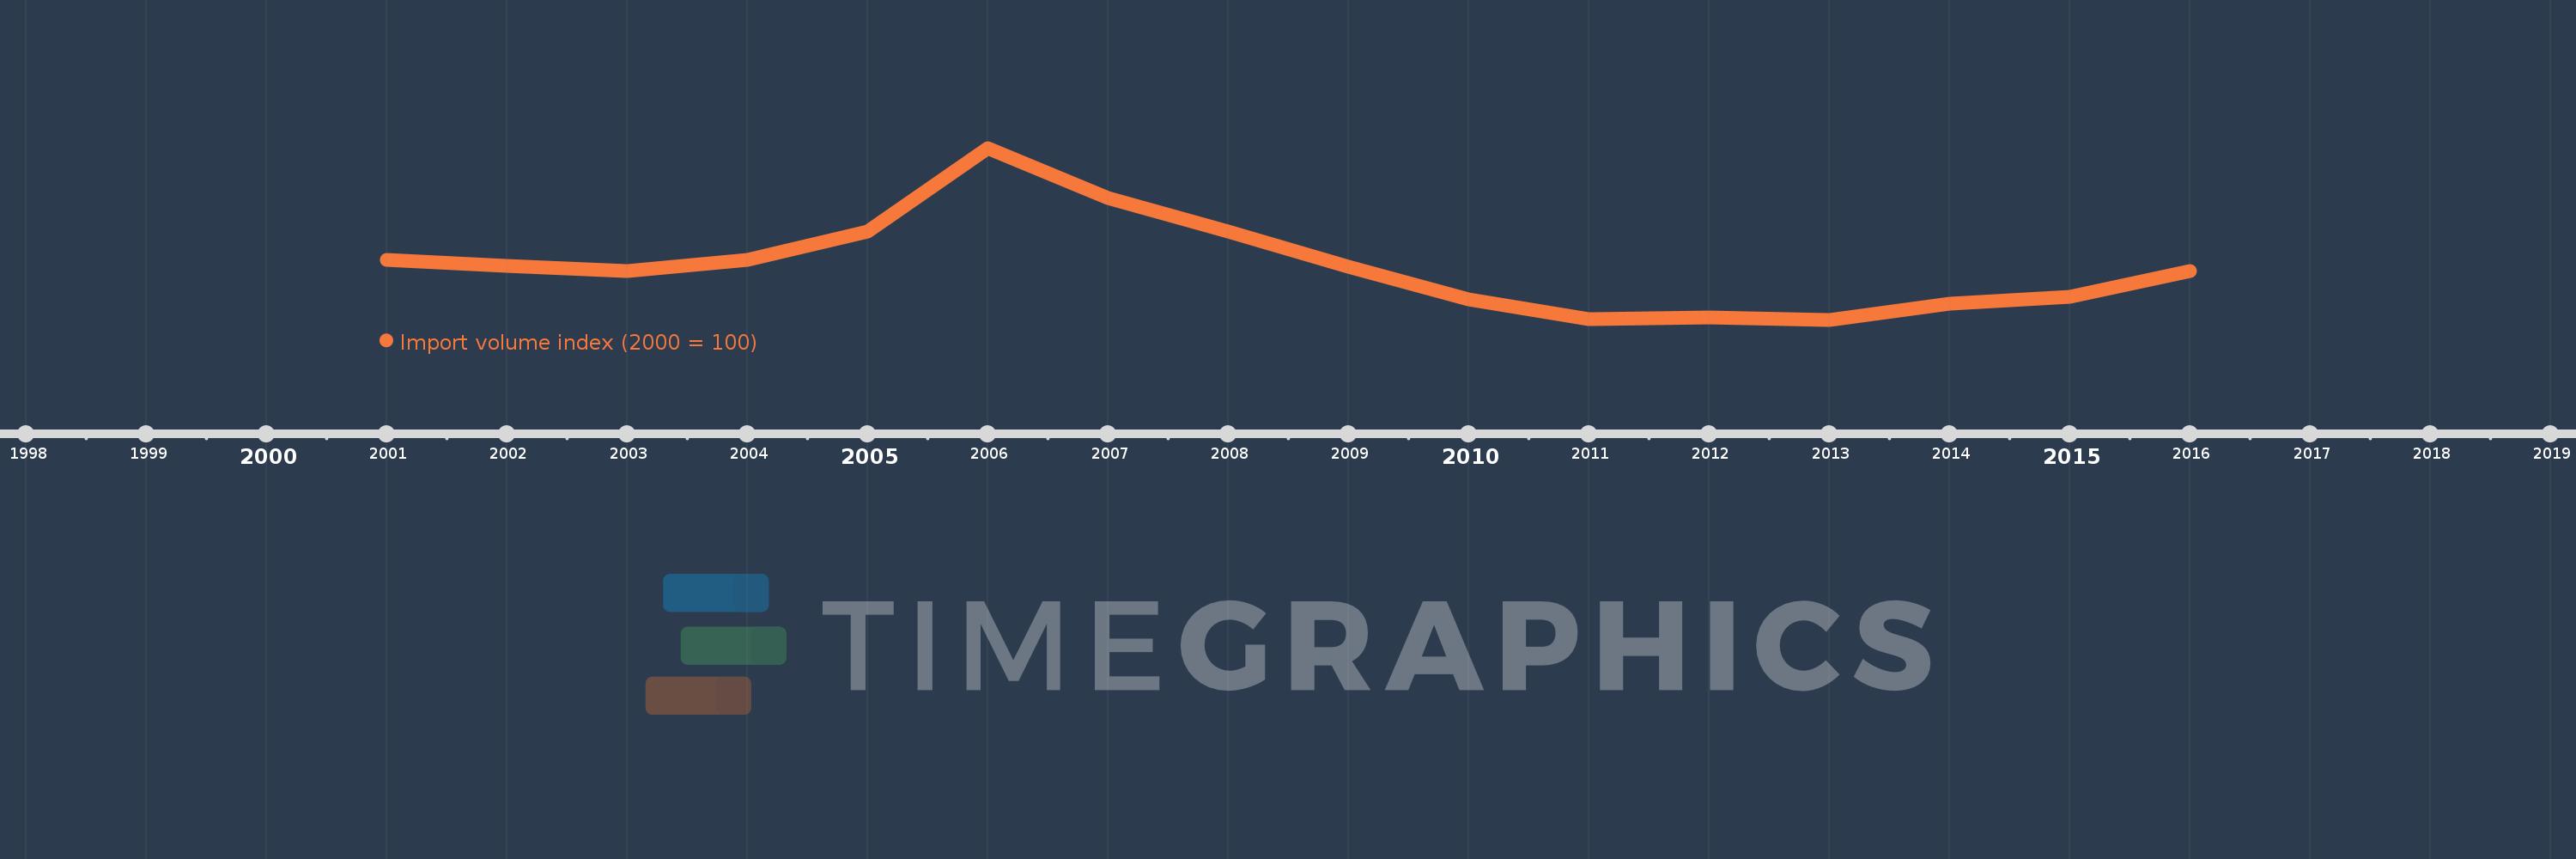
This timeline shows a graph from 2001 to 2016 of Cayman Islands. No data until 2000. Number of actual observations by date: 16.
Source name:
World Development Indicators
Source organization:
United Nations Conference on Trade and Development, Handbook of Statistics and data files, and International Monetary Fund, International Financial Statistics.
Categories, topics:
Private Sector, Trade
Last updated:
apr 23, 2017
Indicators value changes by year
Meaning:
95.762
Minimum:
61.24
jan 1, 2013
Maximum:
171.977
jan 1, 2006
At the date of observation
Value
Absolute change
Change from the previous value
jan 1, 2001
100.0
+100.0
0.0%
jan 1, 2002
95.795
-4.205
-4.2%
jan 1, 2003
92.62
-3.175
-3.31%
jan 1, 2004
99.747
+7.127
7.69%
jan 1, 2005
118.046
+18.299
18.35%
jan 1, 2006
171.977
+53.93
45.69%
jan 1, 2007
139.655
-32.322
-18.79%
jan 1, 2008
118.294
-21.361
-15.3%
jan 1, 2009
95.476
-22.819
-19.29%
jan 1, 2010
74.398
-21.078
-22.08%
jan 1, 2011
61.886
-12.512
-16.82%
jan 1, 2012
62.548
+0.661
1.07%
jan 1, 2013
61.24
-1.308
-2.09%
jan 1, 2014
71.786
+10.546
17.22%
jan 1, 2015
76.026
+4.24
5.91%
jan 1, 2016
92.698
+16.672
21.93%
Ranking of countries by current statistics by years