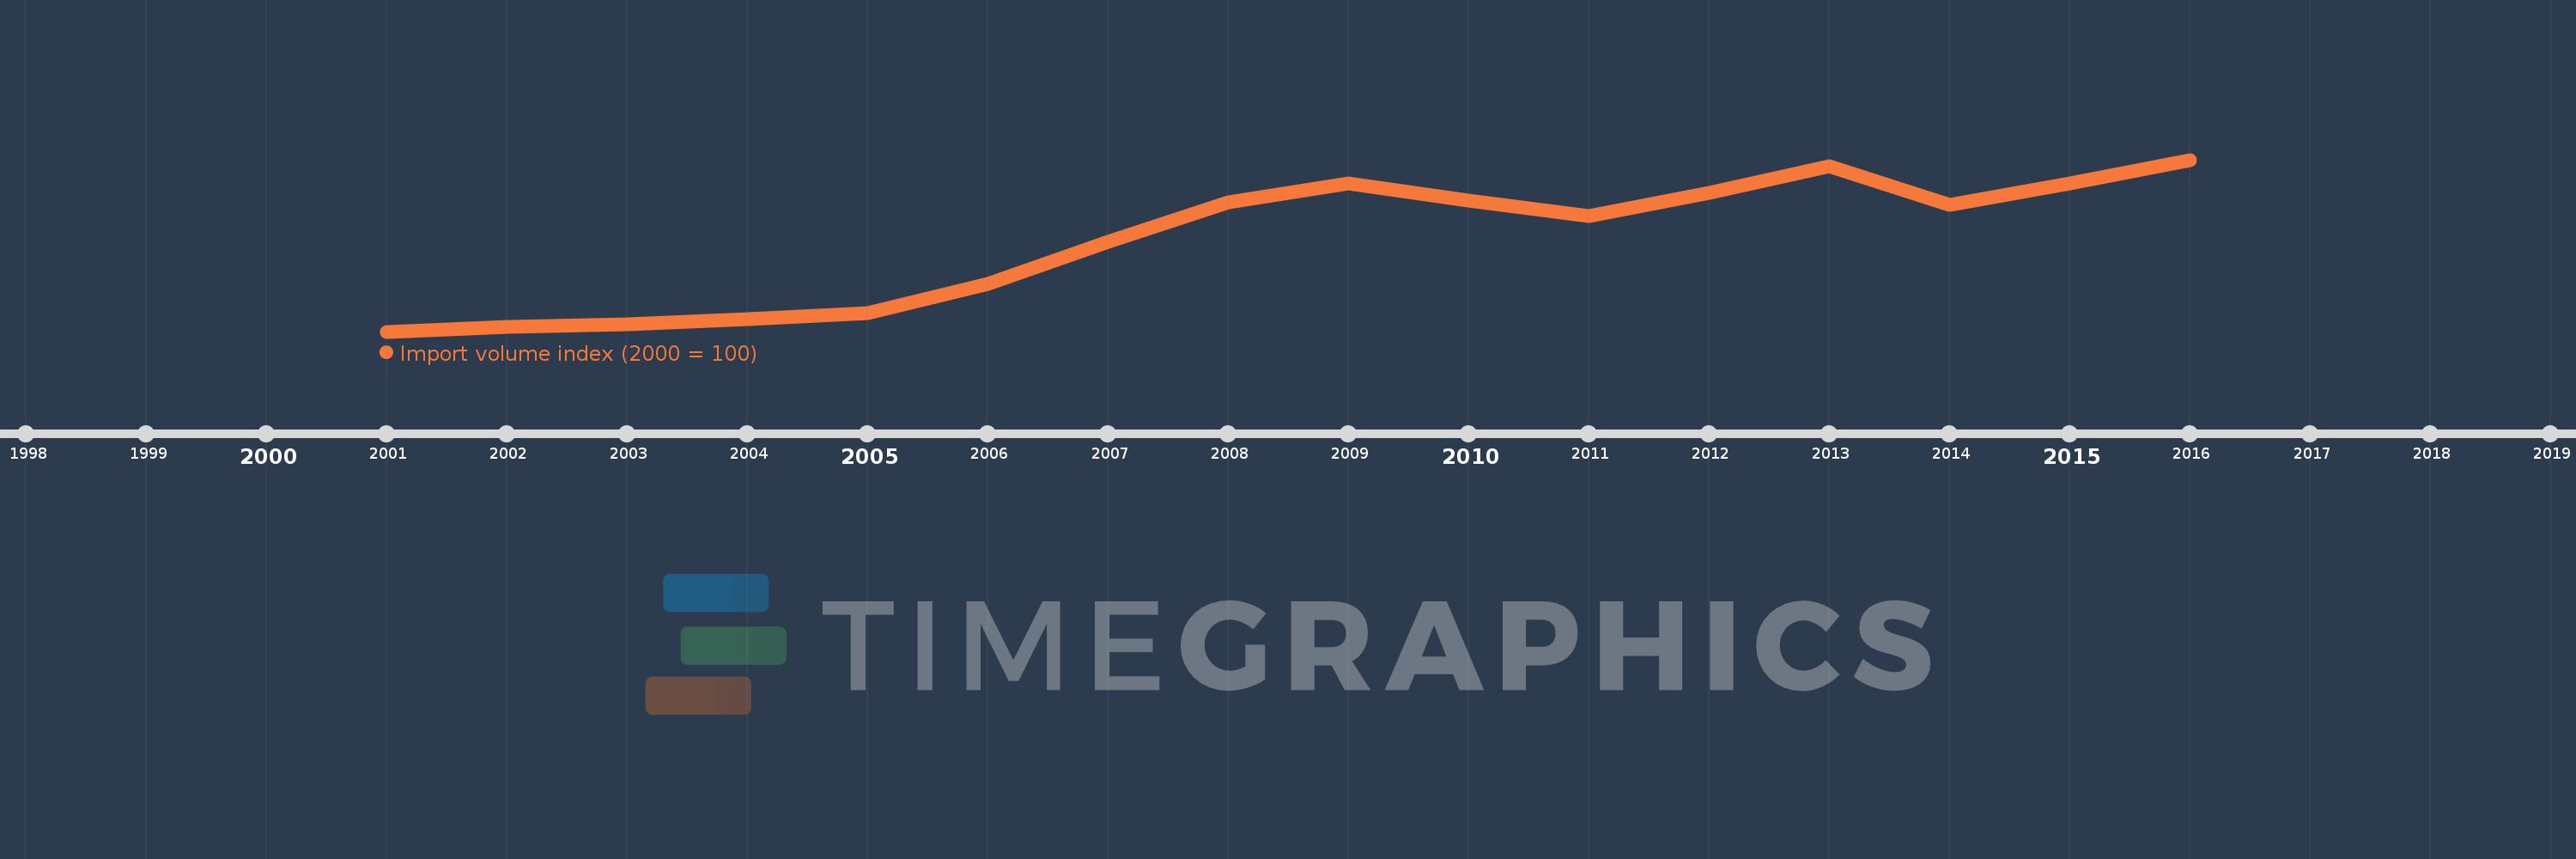
This timeline shows a graph from 2001 to 2016 of Qatar. No data until 2000. Number of actual observations by date: 16.
Source name:
World Development Indicators
Source organization:
United Nations Conference on Trade and Development, Handbook of Statistics and data files, and International Monetary Fund, International Financial Statistics.
Categories, topics:
Private Sector, Trade
Last updated:
apr 23, 2017
Indicators value changes by year
Meaning:
420.752
Minimum:
100.0
jan 1, 2001
Maximum:
705.958
jan 1, 2016
At the date of observation
Value
Absolute change
Change from the previous value
jan 1, 2001
100.0
+100.0
0.0%
jan 1, 2002
115.876
+15.876
15.88%
jan 1, 2003
124.999
+9.123
7.87%
jan 1, 2004
144.845
+19.846
15.88%
jan 1, 2005
166.104
+21.259
14.68%
jan 1, 2006
267.094
+100.991
60.8%
jan 1, 2007
416.74
+149.646
56.03%
jan 1, 2008
556.375
+139.635
33.51%
jan 1, 2009
623.256
+66.881
12.02%
jan 1, 2010
562.013
-61.243
-9.83%
jan 1, 2011
506.137
-55.877
-9.94%
jan 1, 2012
590.542
+84.405
16.68%
jan 1, 2013
682.962
+92.42
15.65%
jan 1, 2014
547.729
-135.233
-19.8%
jan 1, 2015
621.399
+73.67
13.45%
jan 1, 2016
705.958
+84.559
13.61%
Ranking of countries by current statistics by years