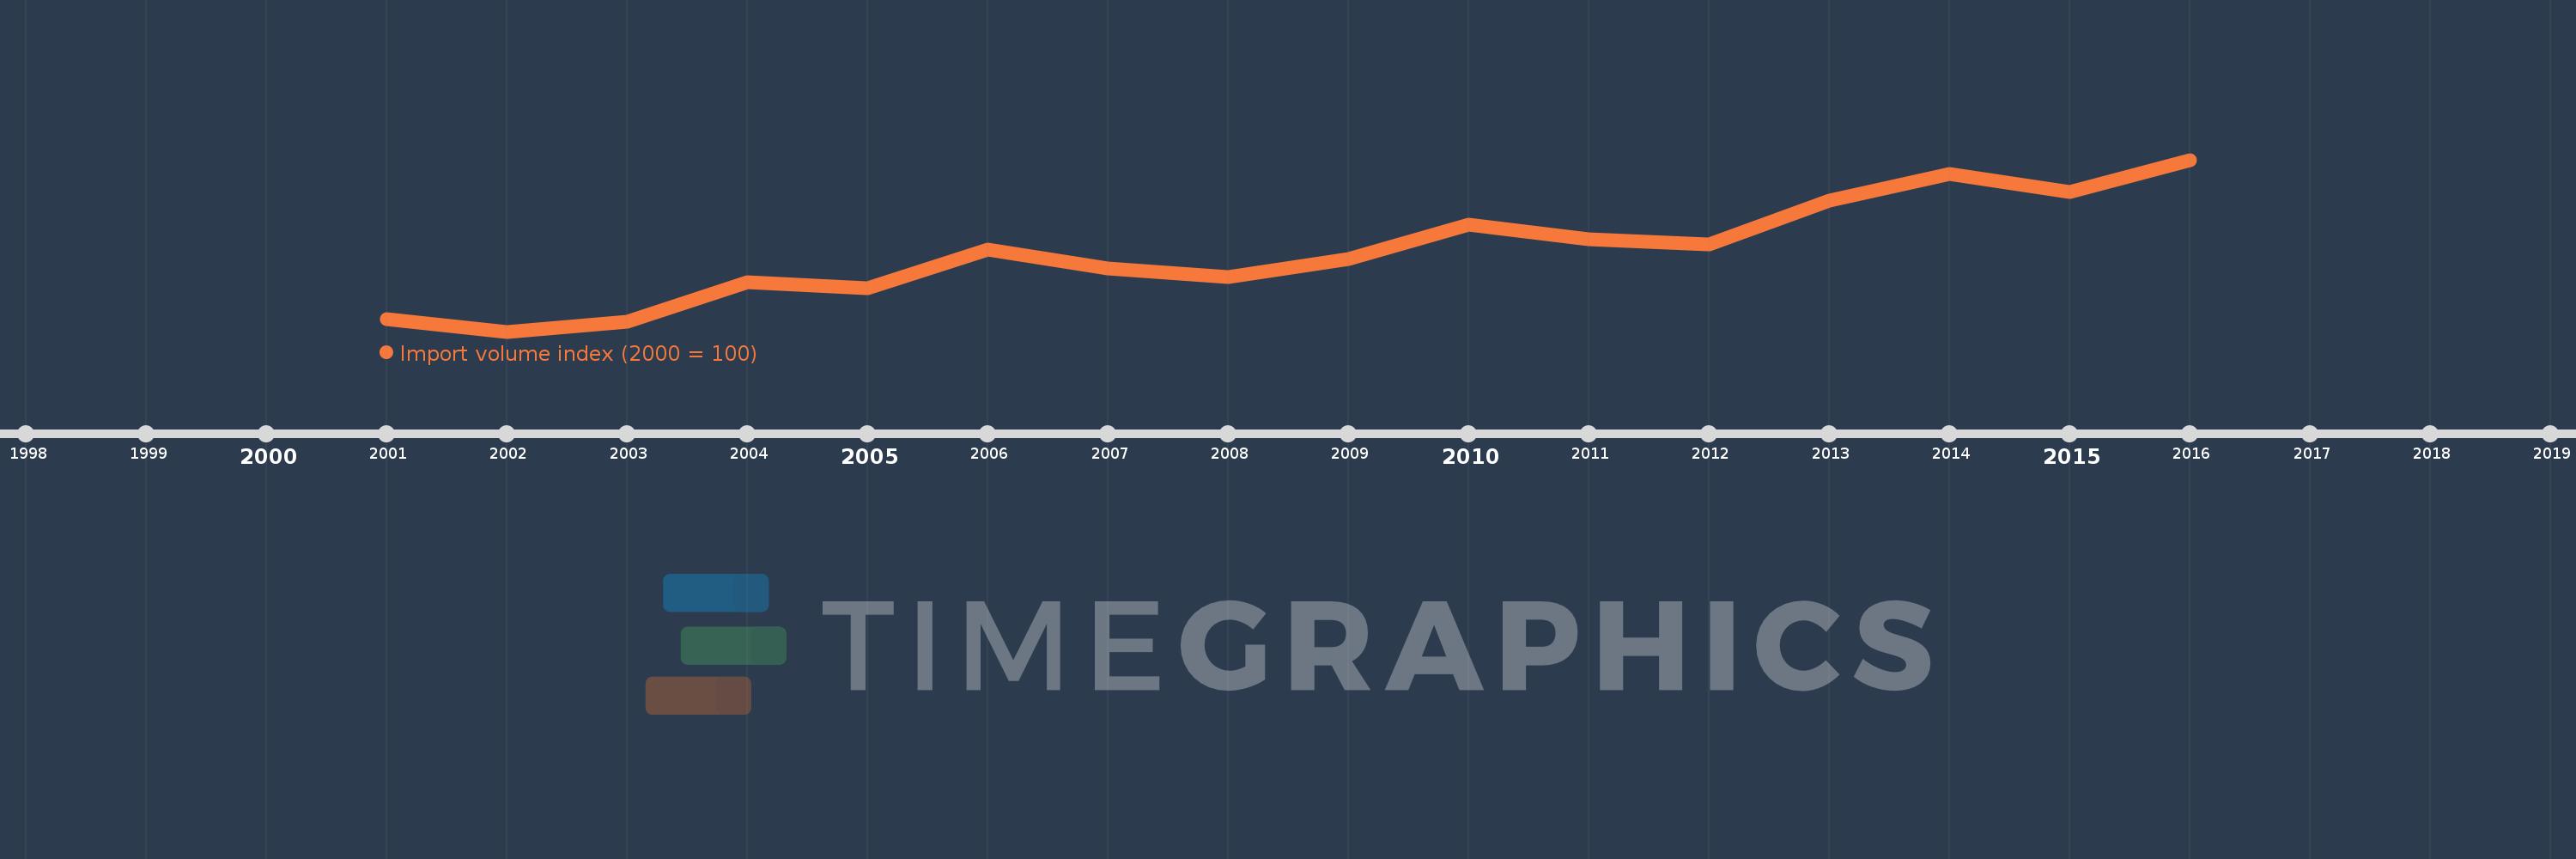
This timeline shows a graph from 2001 to 2016 of Suriname. No data until 2000. Number of actual observations by date: 16.
Source name:
World Development Indicators
Source organization:
United Nations Conference on Trade and Development, Handbook of Statistics and data files, and International Monetary Fund, International Financial Statistics.
Categories, topics:
Private Sector, Trade
Last updated:
apr 23, 2017
Indicators value changes by year
Meaning:
153.502
Minimum:
90.116
jan 1, 2002
Maximum:
226.728
jan 1, 2016
At the date of observation
Value
Absolute change
Change from the previous value
jan 1, 2001
100.0
+100.0
0.0%
jan 1, 2002
90.116
-9.884
-9.88%
jan 1, 2003
98.062
+7.947
8.82%
jan 1, 2004
129.452
+31.39
32.01%
jan 1, 2005
124.882
-4.57
-3.53%
jan 1, 2006
155.438
+30.556
24.47%
jan 1, 2007
140.024
-15.414
-9.92%
jan 1, 2008
133.817
-6.207
-4.43%
jan 1, 2009
147.606
+13.789
10.3%
jan 1, 2010
174.986
+27.38
18.55%
jan 1, 2011
163.511
-11.475
-6.56%
jan 1, 2012
159.772
-3.739
-2.29%
jan 1, 2013
194.47
+34.698
21.72%
jan 1, 2014
215.738
+21.268
10.94%
jan 1, 2015
201.439
-14.299
-6.63%
jan 1, 2016
226.728
+25.289
12.55%
Ranking of countries by current statistics by years